How AI is Changing Cloud Cost Management: MCP, Slack Bots, and Natural Language FinOps
AI-powered cloud cost management through MCP servers, Slack bots and natural language queries is replacing dashboard-first FinOps. Here is how it works.

Xplorr team
The people who build Xplorr
In this post
- What’s Wrong With Dashboard-Only FinOps?
- What Is Natural Language FinOps?
- What Is MCP and How Does It Apply to Costs?
- What Happens During an MCP Tool Call?
- What Can You Ask Through MCP?
- Why Put a Cost Bot in Slack?
- How Does the Bot Combine Multiple Tools?
- Can Each Channel Get Its Own View?
- What Goes in a Daily Digest?
- What Does a Weekly AI Summary Add?
- How Do Approval Workflows Work?
- Why Does Time-to-Insight Matter Most?
- How Do You Get Started?
- Where Is AI Cloud Cost Management Heading?
AI is changing cloud cost management by replacing the dashboard with a question. An MCP server exposes your cost data as tools an AI assistant can call, a Slack bot runs the same tools where your team already talks, and both return an answer instead of a chart you still have to interpret. The data is unchanged. The interface is not.
The tooling got better over the last five years. The interaction model did not.
What’s Wrong With Dashboard-Only FinOps?
Most teams have the cost data. They just do not look at it often enough, and when they do it takes too long to turn an observation into an action.
A typical cost investigation:
- Someone notices the bill went up
- They open the cost management tool
- They filter by date range, account, service and region
- They compare against last month
- They try to work out what changed
- They copy the relevant numbers into Slack or email
- They tag someone who might know
- That person repeats steps 2 to 5 from their own angle
- Maybe something gets done
That is 30 minutes to 2 hours for one cost question, and it happens dozens of times a month in any organization with meaningful spend.
The issue is not the data. It is that dashboards are built for exploration, not for answers. When an engineering lead asks “why did our AWS bill jump 18% last week?”, they do not want a dashboard. They want a sentence.
What Is Natural Language FinOps?
Natural language interfaces invert the model. Instead of navigating a tool, applying filters and interpreting charts, you ask in plain English and get a direct answer.
This is not a gimmick. It is a reduction in time-to-insight. The investigation above, in a Slack channel:
@xplorr why did our AWS spend increase last week?Your AWS spend increased 18.3% week over week ($42,100 to $49,800). The primary driver was EC2 in us-east-1, up $5,200 (+31%). RDS rose $1,400 (+12%). One anomaly was raised: EC2 in us-east-1 on March 14, 2.4x its 7 day average.
Illustrative output. Figures come from whatever your own accounts report.
Same data, same accuracy. But the person asking never left Slack, and the answer arrived in a form they can act on or forward without editing.
That is what AI-powered cloud optimization looks like in practice. Not a smarter dashboard. A different interaction pattern entirely.
What Is MCP and How Does It Apply to Costs?
MCP, the Model Context Protocol, is the open standard that makes this work at the protocol level. It lets AI assistants (Claude, GPT, Copilot and others) connect to external tools and data sources through one standardized interface.
Think of it as a USB port for AI. Rather than building a custom integration per assistant, you expose your capabilities through an MCP server and any MCP-compatible client can use them.
Applied to cloud cost management, that means an AI assistant can:
- Query your actual spend data, as of the latest sync
- Pull cost breakdowns by service, account, region or tag
- Run forecasts from historical trends
- Check budget status and alert configuration
- Surface optimization recommendations
- Trigger syncs with your cloud providers
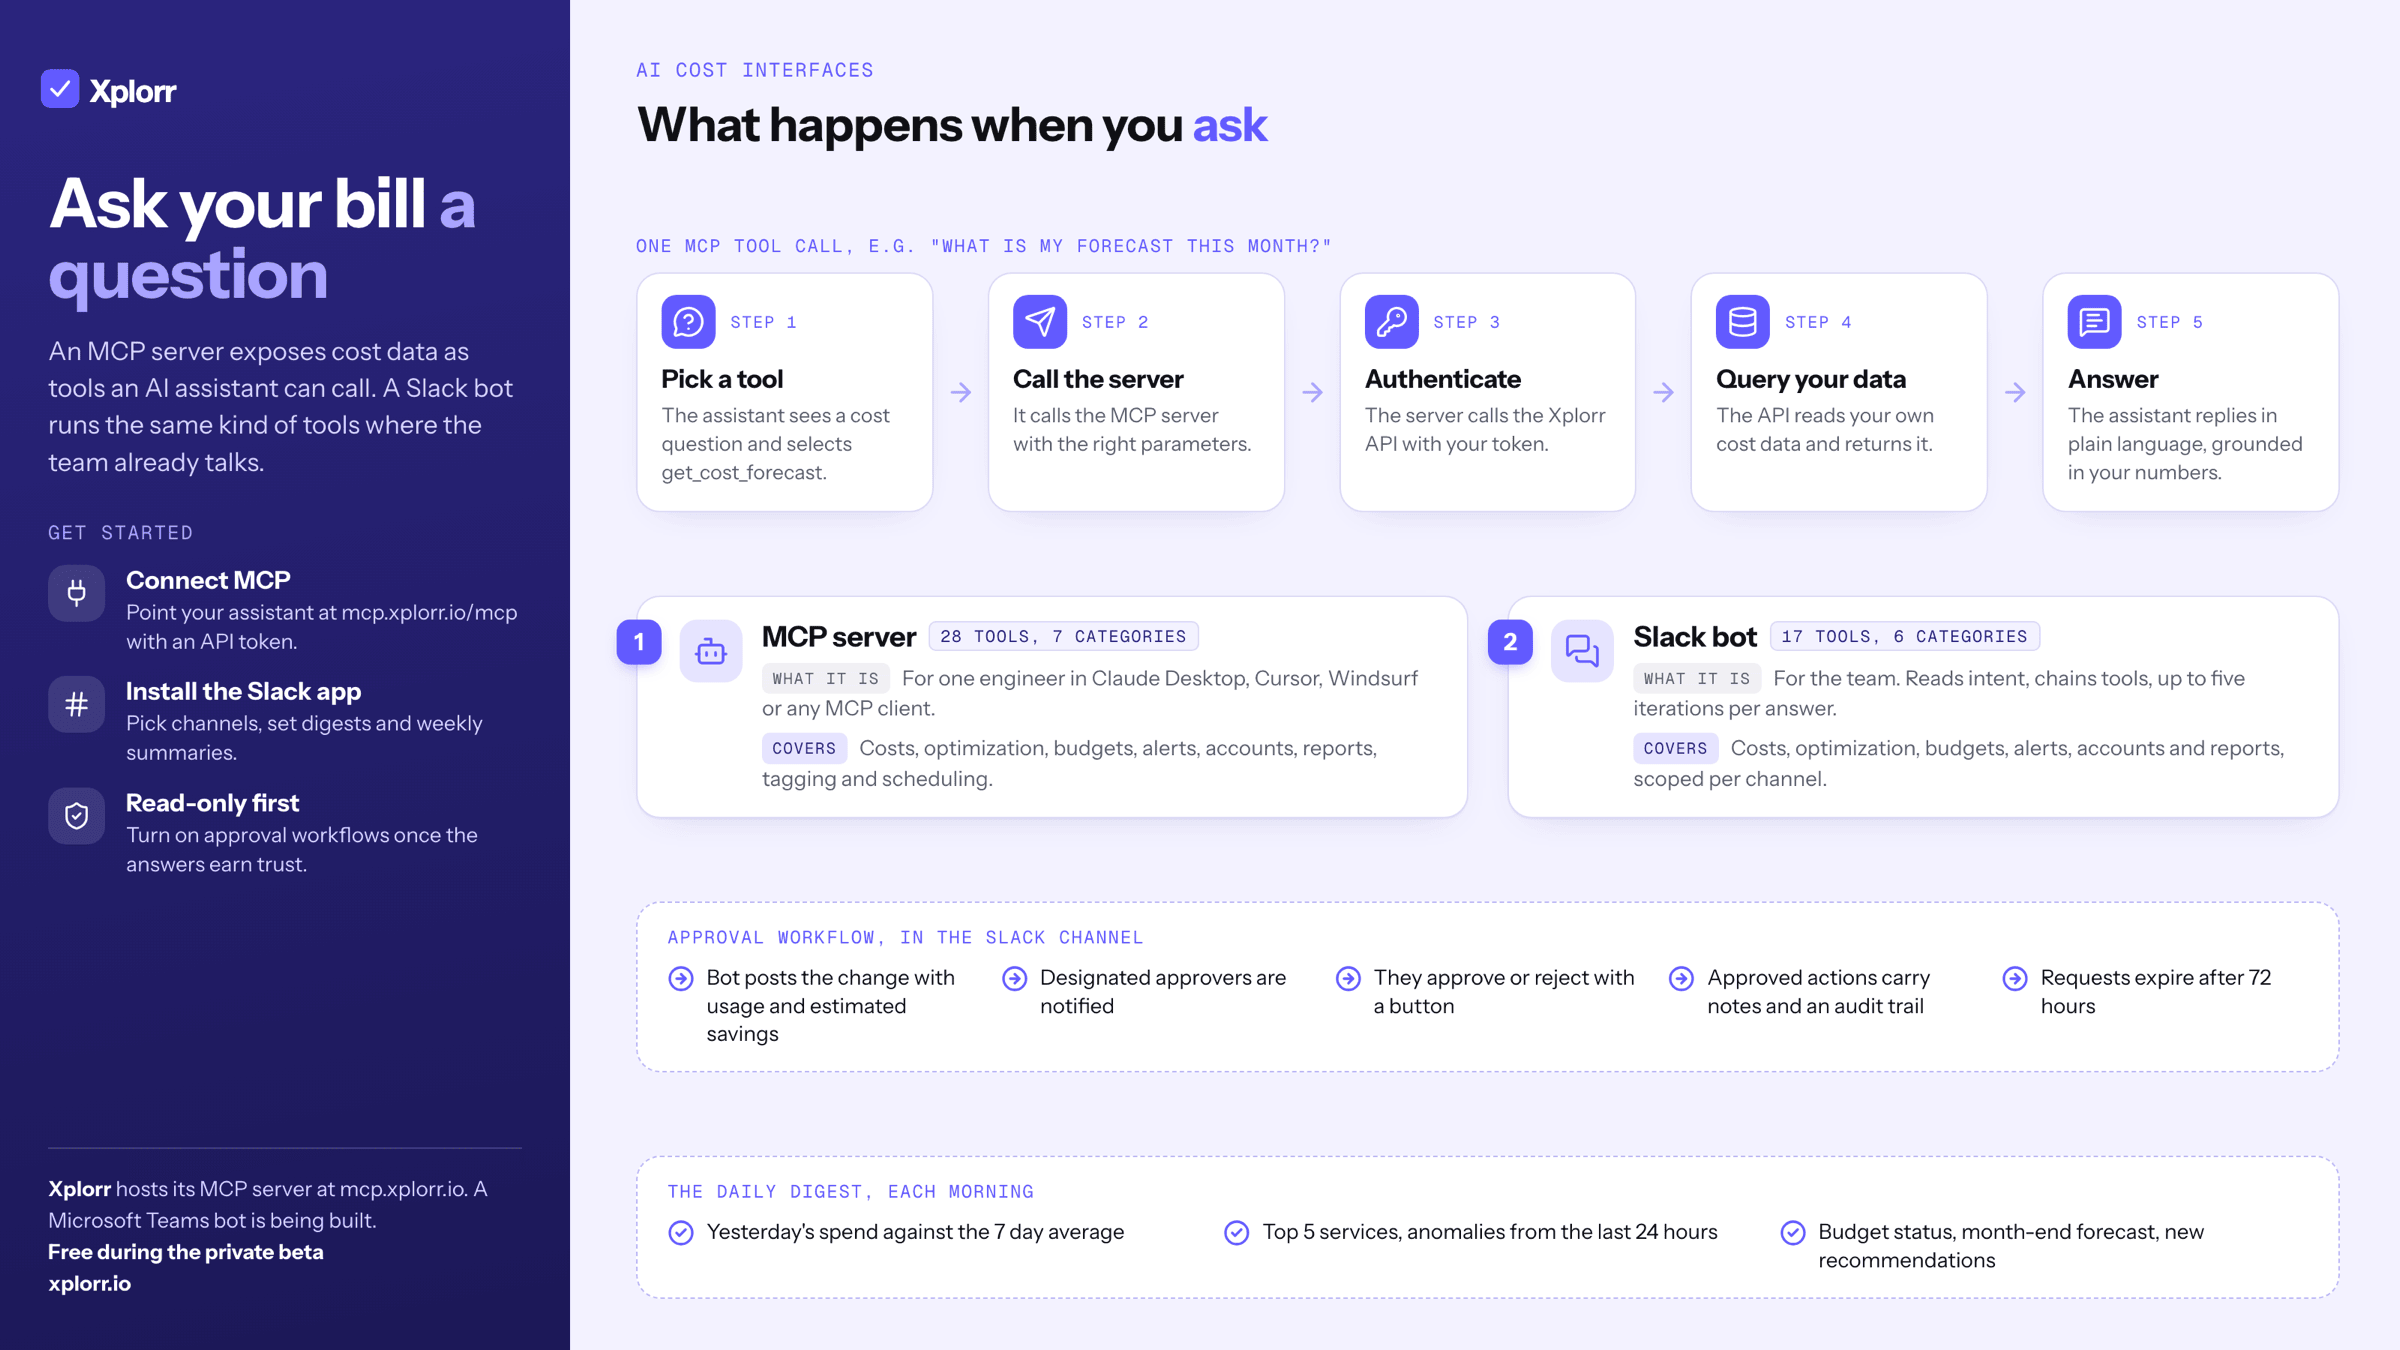
Xplorr’s MCP server exposes 28 tools across seven categories: costs, optimization, budgets, alerts, accounts, reports, and tagging and scheduling.
What Happens During an MCP Tool Call?
Ask Claude “what’s my cost forecast for this month?” and five things happen:
- Claude recognizes a cost question and selects the
get_cost_forecasttool - It calls the MCP server with the appropriate parameters
- The server authenticates against the Xplorr API using your token
- The API queries your cost data and returns the forecast
- Claude renders the result in natural language
The user sees none of that machinery. They ask, they get an answer, and the answer is grounded in real data from their own accounts. Not a hallucination, not a generic best-practice recommendation. Their numbers.
That grounding is the whole point of the protocol. A language model reasoning about cloud costs without tool access is guessing. The same model with a tool call behind it is reading your bill.
What Can You Ask Through MCP?
Realistic examples, each mapping to one or more of the 28 tools:
- “Show me my top 5 most expensive services this month”
- “Compare my February and March spend across all accounts”
- “Are there any cost anomalies in the last 7 days?”
- “What optimization recommendations do I have?”
- “Create a budget alert for $50K on our production AWS account”
The assistant works out which tools to call and how to combine the results. You ask the question.
Connect the server to Claude Desktop, Cursor, Windsurf or any MCP-compatible client and cost questions get answered without a browser tab. For an engineer already in an editor, that removes the context switch that kills most cost investigations before they start.
Why Put a Cost Bot in Slack?
MCP is powerful for individual engineers living in an IDE or AI assistant. For team-wide cost management, Slack is where the conversation already is.
Xplorr’s Slack bot exposes 18 tools across six categories (costs, optimization, budgets, alerts, accounts, reports) driven by an agentic loop on OpenAI function calling. When someone messages it, it does not pattern-match against a command list. It reads intent, selects tools, executes them, and composes a response, running up to five iterations when it needs to combine sources.
The practical difference is that a question nobody would open a dashboard for still gets asked. “Is staging costing more than prod this week?” is a 20-second Slack message and a 20-minute dashboard session, and the second one mostly does not happen.
How Does the Bot Combine Multiple Tools?
Ask something that needs two data sources and it chains them:
@xplorr how much are we spending on EC2 this month,
and is any of it idle?
The bot calls get_top_services for this month, then get_recommendations for open idle resource findings, and merges both:
EC2 spend this month: $8,420
1 idle instance found:
staging-worker-2(m5.xlarge) has averaged 3.2% CPU over the past 7 days. Stopping it or moving to a smaller instance type would remove most of its cost.
Illustrative output. Figures come from whatever your own accounts report.
Two tool calls and one answer, without anyone leaving Slack.
Can Each Channel Get Its Own View?
Not every channel needs the same cost view. In Xplorr today the daily digest and the weekly summary can post to more than one Slack channel, and each of them gets the whole organization’s numbers. Alerts go to the one channel the workspace was linked with.
Per channel scoping, where a production channel sees only production accounts and an ML channel sees only its tags or services, is in development. Until it ships, a team that wants a narrower view can ask the bot directly: “what did the data platform account cost this week?” gets an answer for that account alone.
What Goes in a Daily Digest?
The interactive question-and-answer is not actually the highest-impact feature. Proactive notification is, because the savings come from surfacing problems before anyone thinks to ask.
Every day at 09:00 UTC, the digest posts:
- The last complete day’s spend and the change against its 7 day average
- Top services by cost
- Any spikes that anomaly detection raised for that day
- Budget status for each budget
- End of month forecast
- Open optimization recommendations and their estimated savings
It is quick to scan. If everything looks normal you move on. If something spiked, you mention the bot with a follow up question in the channel. No context switch, no tool hopping, and the follow up happens because the bot is already there.
What Does a Weekly AI Summary Add?
Every Monday morning, an AI-written summary of the previous week’s spend. Not a table dump, a short narrative that names what moved:
“Cloud spend decreased 4.2% week-over-week to $41,300, primarily driven by the staging RDS downsize implemented Wednesday. However, EC2 data transfer costs in us-west-2 increased 22% and should be investigated. This correlates with the new cross-region replication setup deployed Thursday.”
Illustrative output. Figures come from whatever your own accounts report.
Below the narrative sits the structured data: week-over-week delta, provider breakdown, top cost movers, anomaly totals, and the estimated savings of recommendations marked applied.
This is the format a VP of Engineering or a CFO will actually read. Not a 47-tab dashboard. A paragraph and a table, delivered where they already look every morning. The narrative is what makes it forwardable, and forwardable is what makes it acted on.
How Do Approval Workflows Work?
Finding waste is half the problem. Acting on it is where most cost optimization stalls, because nobody wants to be the person who terminated something and caused an outage.
On Xplorr’s Enterprise plan, a recommendation can go through a structured approval before anyone acts on it:
- Someone clicks Request approval on the recommendation in the console
- The request lands on the Approvals page with the resource, the estimated savings and who asked
- An admin approves or rejects it, with a reason
- Every request and decision is recorded in the audit log
- A request expires after 72 hours and can be raised again
Approving and rejecting from a Slack message is in development. Even from the console, it turns “we should probably right-size that database” from a TODO living in someone’s head for three months into a decision with a paper trail attached.
Why Does Time-to-Insight Matter Most?
The metric that matters in FinOps is not percentage saved. It is how long it takes to get from “something seems off” to “here is what is happening and what to do”.
With traditional dashboards, the first insight means logging in, navigating, filtering and interpreting. Sharing it means a screenshot, some context and a message. Acting on it means tickets, meetings and approvals.
With a chat interface, the first insight is one question. Sharing it costs nothing, because the answer is already in the channel. Acting on it still takes a decision, but the conversation that leads to one starts sooner.
The compounding matters more than any single lookup. A question that takes seconds gets asked every time someone wonders. A question that takes a dashboard session gets asked when something has already gone wrong.
How Do You Get Started?
For individual use, via MCP. Connect Xplorr’s MCP server to your assistant of choice. The hosted endpoint is at mcp.xplorr.io/mcp and you will need an API token from your Xplorr account. Once connected, ask cost questions in plain language. The 28 tools span high-level summaries through resource-level drill-downs.
For team use, via Slack. Install the Xplorr Slack app and the Xplorr team links the workspace to your organization and the channels that get the digest and weekly summary. The 18 tools give the whole team self-service access without everyone needing dashboard logins.
For both. Start with read-only queries to build trust. Once the team sees fast, accurate answers, use approval workflows in the console for optimization actions. See the AWS, Azure, and GCP integrations for what has to be connected first.
Where Is AI Cloud Cost Management Heading?
FinOps as a practice is not going away. The tools are changing. The next generation of cloud cost management will not be built around dashboards humans navigate. It will be built around interfaces humans talk to.
MCP is the protocol layer. Chat tools like Slack are the delivery layer. Language models are the intelligence layer. Together they produce cost management that is faster, more accessible and more actionable than a dashboard can be.
The teams that get there first end up with a structural advantage: faster response to anomalies, and finance teams that understand where the money goes without needing a certification to read a cost explorer.
Keep reading
- AWS Cost Optimization Strategies That Actually Work
- Hidden Cloud Costs You’re Probably Missing Right Now
- How to Cut Your AWS Bill in One Week: A Practical Checklist
See how Xplorr helps → Features
Xplorr shows your AWS, Azure and GCP spend in one place, with anomaly detection, budgets and rightsizing recommendations. Get started free.
Written by
Xplorr team
The people who build Xplorr
Written together by the engineers who build Xplorr: the AWS, Azure, GCP and Kubernetes collectors, the console, and the alerting behind them.
About Xplorr