See the report before you send it to finance
Most cost exports are generated blind and checked after somebody has already read them. Reports previews the spend for a date range on screen first, with the total, a figure per provider and the services behind it, and only then downloads the same numbers as CSV, Excel or PDF.
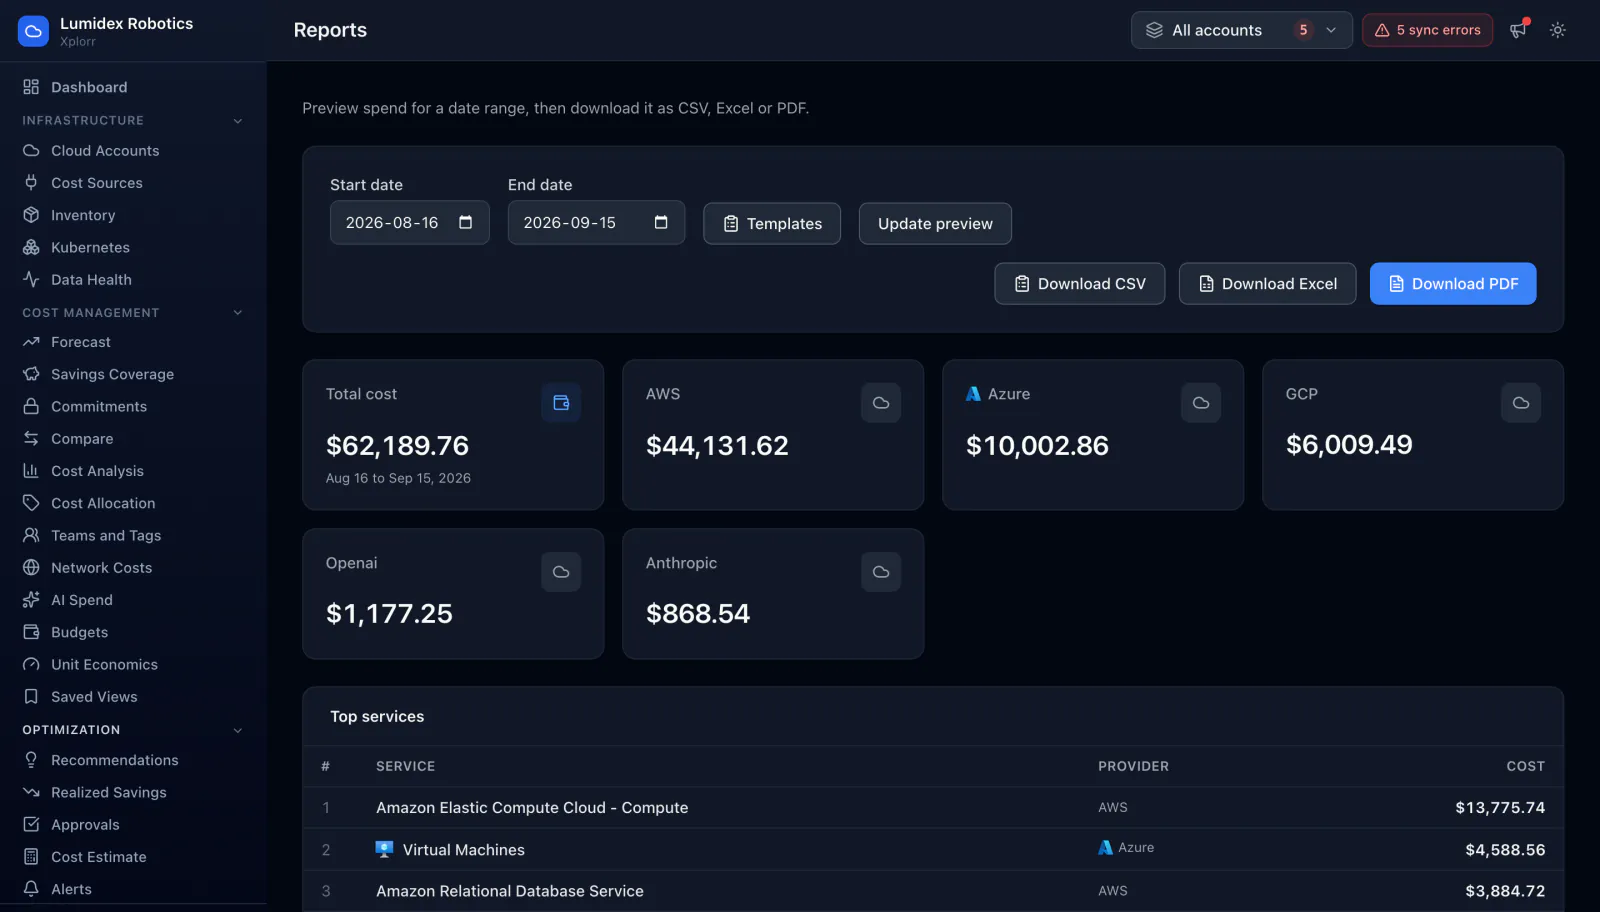
Inputs
Where the Reports numbers come from
Xplorr reads your accounts with read only credentials and never writes to your infrastructure. These are the sources behind this screen.
- The same daily cost data as every other page
- A report is built from the stored daily totals that the cost pages read, so an exported figure and the console figure for the same range cannot disagree.
- Every connected provider
- AWS, Azure, GCP and the connected AI sources are all included, which is what makes a single total meaningful rather than a per cloud export somebody has to add up.
- The date range you choose
- A report is defined by an explicit start and end date rather than a fixed calendar month, so a range that matches a billing cycle, a quarter or an audit window is possible.
Method
How the Reports numbers are worked out
No black box. If a figure is an estimate or an apportionment rather than a billed line, the page says so.
The preview is the report
What renders on screen is generated from the same query as the file. Previewing first means a wrong date range is caught before a PDF reaches somebody rather than after.
Totals are broken out per provider
The report carries an overall total plus a figure for each provider. A single aggregate hides the one cloud that moved, which is usually the reason the report was asked for.
Services are ranked within the range
Top services are listed with the provider that billed them and their cost for the selected period, so the report answers where the money went without anyone opening a second page.
The format follows the reader, not the data
CSV for somebody who will pivot it, Excel for somebody who will circulate it, PDF for somebody who will file it. The numbers are identical across all three, so the choice is about the recipient rather than the content.
Templates keep a recurring report consistent
A report you produce every month should not be reassembled by hand each time. Templates hold the shape so the same report means the same thing in March as it did in January.
In the console
What is on the Reports screen
- An explicit start date and end date, with an update preview control
- Total cost for the selected range
- A separate total per provider, covering clouds and AI sources
- A ranked top services table with the provider and cost for each
- Download as CSV, Excel or PDF from the same preview
- Report templates for the ones you run repeatedly
Common questions about Reports
Do the three formats contain the same numbers?
Can a report cover a range that is not a calendar month?
Does a report include AI spend as well as cloud?
Does the recipient need a Xplorr login?
Background reading
What a monthly cost review should cover, and who should read it, is part of FinOps best practices for engineering teams.
Related features
How this compares
See this on your own accounts
Connect a cloud account with read only credentials and the first sync pulls your last 30 days, so this screen fills with your numbers instead of the demo workspace. Free during beta.