FinOps Best Practices for Engineering Teams
FinOps best practices for engineering teams: cost ownership, tagging that sticks, dashboard design, monthly reviews and where FinOps sits in the org.

Xplorr team
The people who build Xplorr
In this post
- Why Should Engineers Own Cost, Not Finance?
- What Makes Cost Ownership Stick?
- How Many Tags Should You Require?
- Why Do Long Tag Lists Fail in Practice?
- Which Five Tags Should You Require?
- How Do You Enforce Tags at Deploy Time?
- How Do You Keep Tag Values Consistent?
- What Should an Executive Dashboard Show?
- What Should a Team Dashboard Show?
- Why Do Dashboards Alone Change Nothing?
- What Does a Monthly Cost Review Look Like?
- What Kills a Cost Review?
- Where Should FinOps Sit in Your Org?
- Where Do FinOps Programs Go Wrong?
- What Else Goes Wrong?
- How Do You Start This Week?
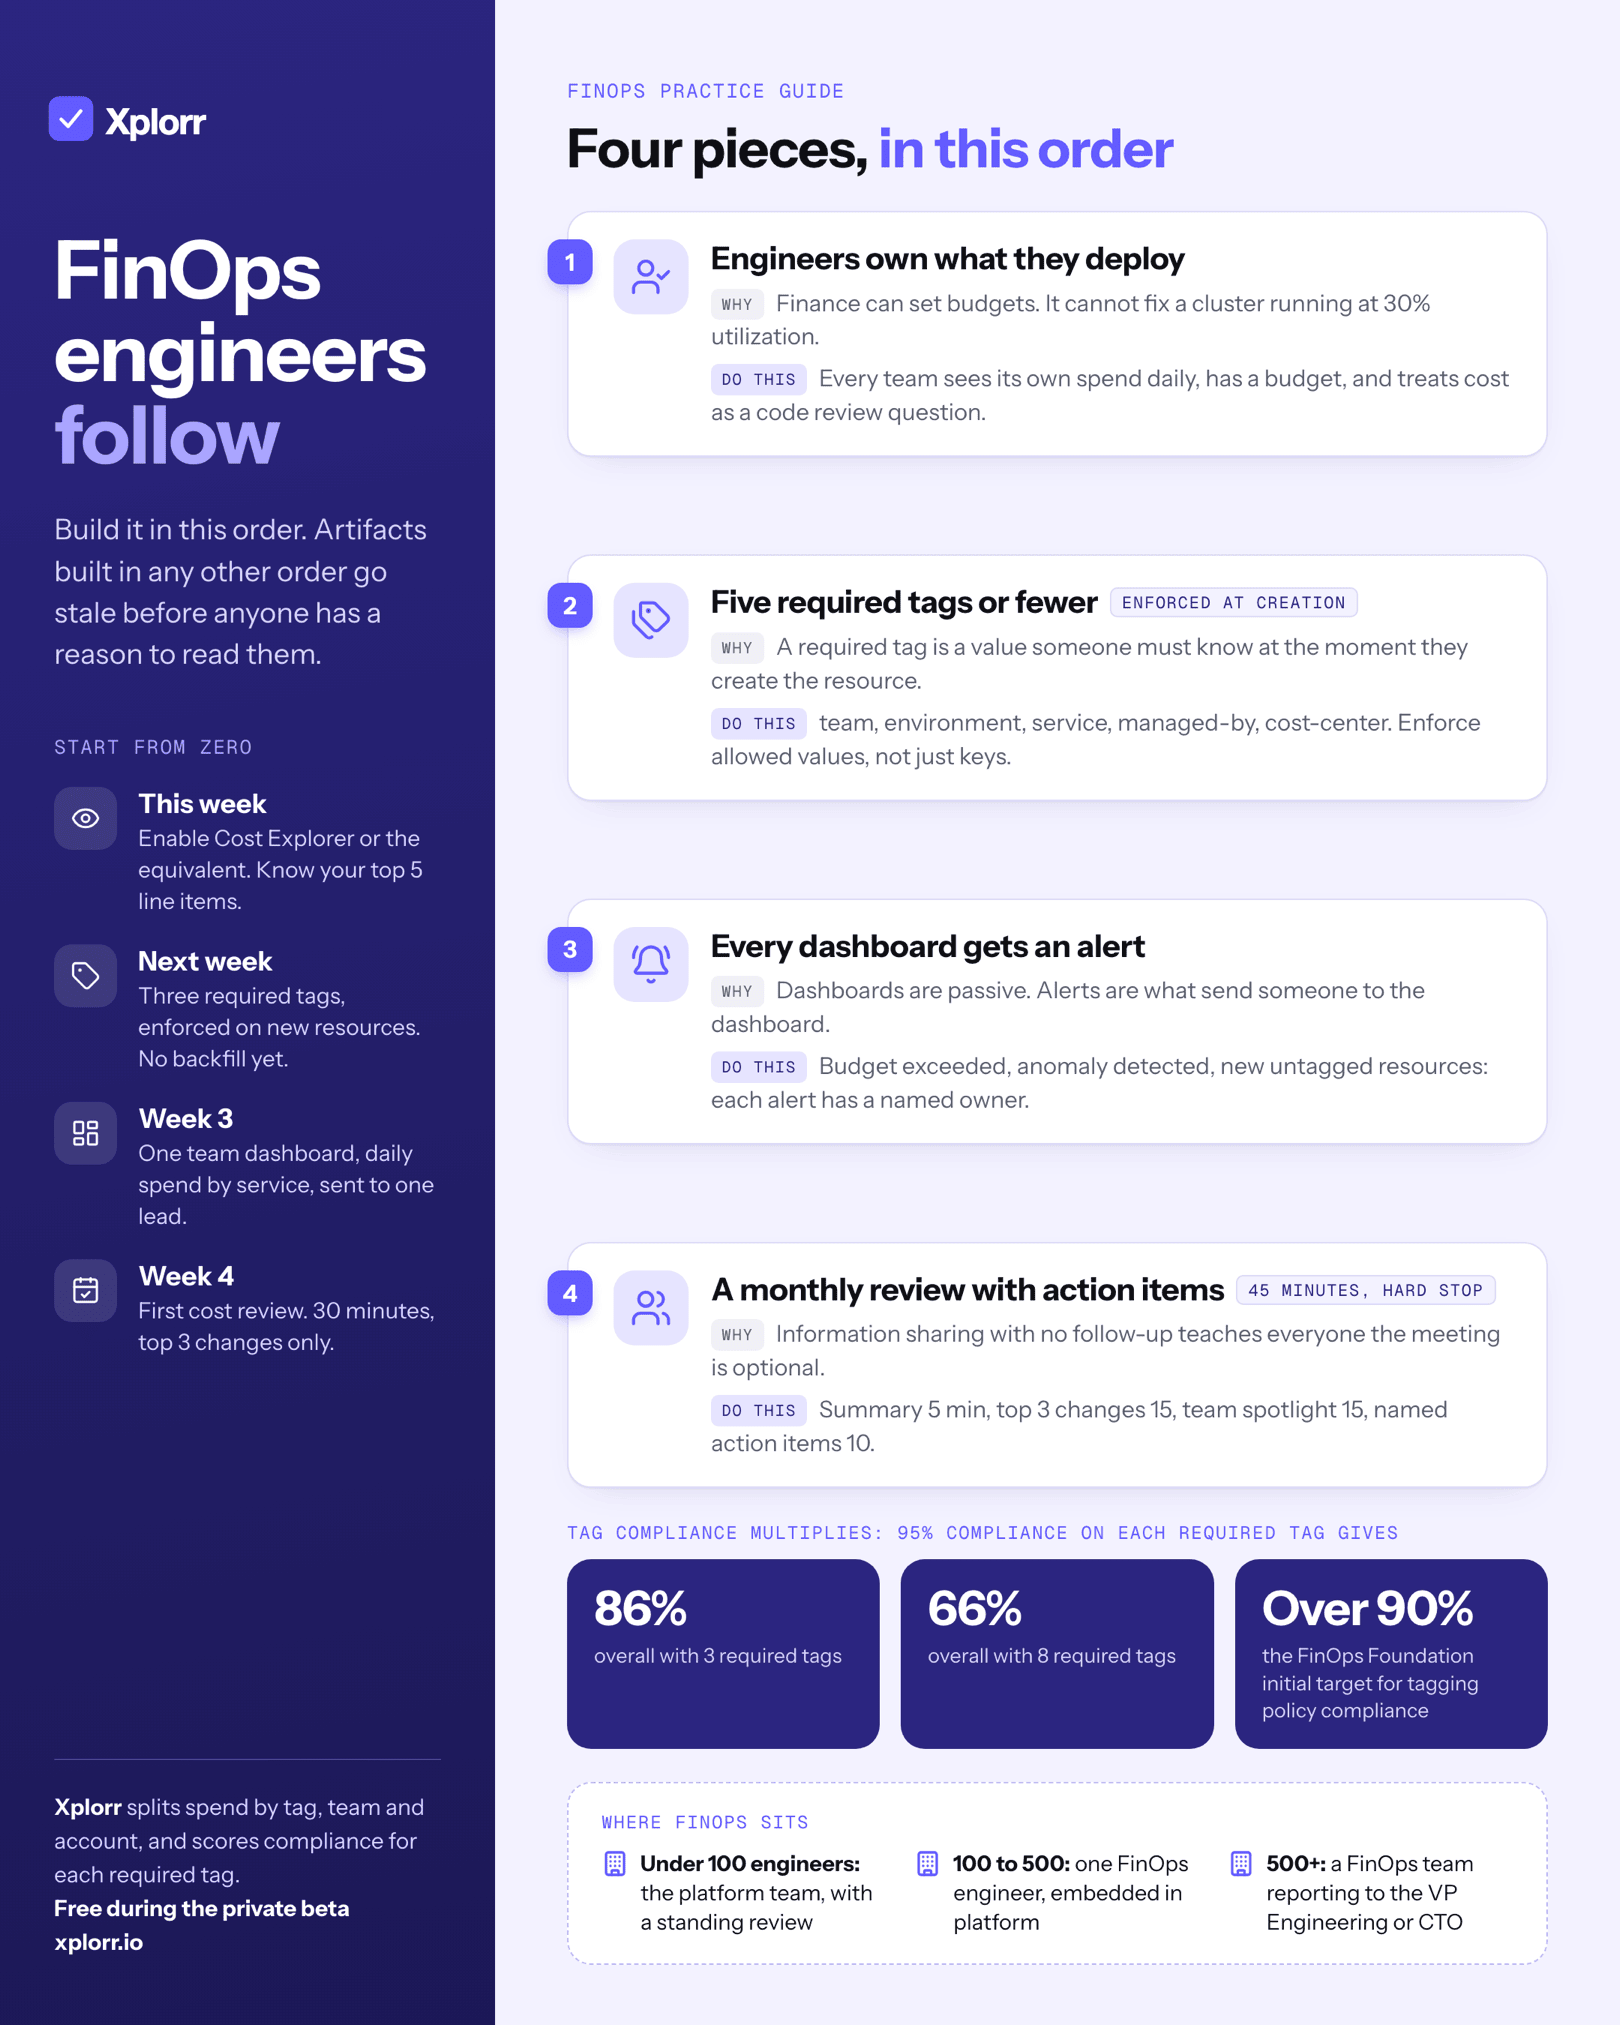
A FinOps practice works when engineers own the cost of what they deploy, required tags number five or fewer and are enforced at creation, every dashboard has an alert attached to it, and the monthly review ends in named action items. Build in that order. Artifacts built in any other order go stale.
The failure mode is not the artifacts. It is building the tagging policy, the Grafana boards and the 14-page review runbook before anyone in engineering has a reason to care what they say.
Why Should Engineers Own Cost, Not Finance?
The biggest mistake in FinOps adoption is treating cloud cost as a finance problem. Finance can set budgets and flag anomalies. Finance cannot fix a Kubernetes cluster running at 30% utilization, and cannot re-evaluate the decision to use a db.r6g.2xlarge where a db.r6g.large carries the load.
Cost ownership means the team that deploys it is responsible for what it costs.
Obvious written down, and resisted in practice for three reasons:
- Engineers were never trained to think about cost
- There is no feedback loop. You deploy something and never see the bill
- Incentives are misaligned. Shipping fast is rewarded, spending efficiently is not
None of those is a culture problem exactly. All three are fixable with mechanism, which is what the next section is.
What Makes Cost Ownership Stick?
Three mechanisms, in order of how much they change behavior.
Visibility at the team level. Every team sees its own spend, broken down by service, updated daily. Not a monthly PDF from finance. A live view they can open whenever they want. If an engineer cannot answer “what does my team’s infrastructure cost per month?” in 60 seconds, you do not have cost ownership yet.
Budgets with consequences, of the informational kind. Each team gets a monthly budget based on actual spend plus a growth margin. Exceeding it notifies the team lead, who is expected to explain it at the next review. Usually the answer is legitimate (three new customers onboarded). Sometimes it surfaces waste nobody had noticed.
Cost as a code review consideration. The programs that work treat cost implications the way they treat security implications: not a hard gate, but a normal question. “This PR adds an RDS instance. Does the existing one have capacity?”
How Many Tags Should You Require?
Five or fewer. Every additional required tag makes the policy less likely to be followed, and the reason is mechanical rather than cultural.
A required tag is a value someone must know at the moment they create a resource. environment is trivial: the engineer already knows whether this is staging. cost-center is not: it lives in a finance system the engineer may never have opened, and it changes when the org chart does.
Each tag you add pulls in another value of the second kind. Compliance on the whole policy is the product of compliance on each tag, not the average. At 95% per tag, three tags lands around 86% overall. The same 95% across eight tags lands around 66%, without anyone becoming less diligent.
The FinOps Foundation treats above 90% as the initial target for tagging policy compliance and warns against “nice-to-have” tagging not tied to a decision someone will actually make.
Why Do Long Tag Lists Fail in Practice?
There is a second effect beyond arithmetic, and it is the one that quietly destroys allocation data.
A long required-tag list gets enforced with a deny policy. A deny policy that blocks deploys over a tag nobody can populate gets an exemption carved out for the team that complains loudest. Once one exemption exists the tag is optional in practice, and your allocation data has a hole in it that the compliance number does not show.
So the compliance dashboard reads 94% while a whole business unit’s spend is unattributed. Nobody is lying. The metric simply stopped measuring the thing you cared about the moment the first exemption was granted.
Pick the smallest set of tags that answers the questions you have today. You can add a sixth later, once something specific requires it.
Which Five Tags Should You Require?
| Tag | Example | Purpose |
|---|---|---|
team |
platform, payments, ml-infra |
Cost allocation |
environment |
prod, staging, dev |
Environment-level cost tracking |
service |
api-gateway, user-service |
Service-level cost attribution |
managed-by |
terraform, manual, pulumi |
Identifies how to modify the resource |
cost-center |
ENG-001, DATA-003 |
Maps to finance’s chart of accounts |
That is the whole list. Everything else is optional, and stays optional until somebody can name the decision it will change.
managed-by earns its slot for a non-obvious reason: it tells whoever finds an idle resource whether deleting it in the console will simply be recreated by the next terraform apply.
How Do You Enforce Tags at Deploy Time?
Compliance programs that rely on “please go back and tag your resources” are doomed. Enforcement has to happen at creation.
AWS. Service Control Policies that deny resource creation without the required tags:
{
  "Effect": "Deny",
  "Action": ["ec2:RunInstances", "rds:CreateDBInstance"],
  "Resource": "*",
  "Condition": {
    "Null": {
      "aws:RequestTag/team": "true",
      "aws:RequestTag/environment": "true",
      "aws:RequestTag/service": "true"
    }
  }
}
Azure. Azure Policy with a deny effect for resources missing required tags, applied at the management group level so it covers every subscription including ones created later.
GCP. Organization Policy constraints plus a CI check on Terraform plans. GCP’s native label enforcement is weaker than AWS or Azure, so more of the weight lands on the pipeline.
How Do You Keep Tag Values Consistent?
production, prod, Production, PROD. If all four exist in your account, your cost allocation is already broken, and no dashboard will tell you because each one aggregates cleanly on its own.
Enforce an allowed-value list rather than just requiring the key to be present. SCPs and Azure Policy both support enumerated allowed values. For Terraform shops, put the validation in a shared module so a bad value fails at plan time rather than at month end.
Then audit weekly, not monthly. Run an automated report of untagged resources by team and send it directly to the named team lead, not to a shared channel. A list of twelve resources with one owner gets cleared. The same list in a channel with forty people in it belongs to nobody. Xplorr’s tag governance keeps that list for you, with a compliance score per required tag.
What Should an Executive Dashboard Show?
Most cost dashboards fail because they show everything to everyone. A CFO does not need per-pod Kubernetes costs.
For a CFO or VP of Engineering:
- Total cloud spend, monthly trend, 6-month rolling
- Spend by business unit or product line
- Month-over-month change, annotated with why it moved
- Unit economics: cost per customer, per transaction, per 1,000 API calls
- Budget against actual by department
Keep it to one screen. No scrolling. If the CFO has to scroll, they will not look at it, and a dashboard nobody opens is worse than no dashboard because it creates the impression of coverage.
What Should a Team Dashboard Show?
For engineering managers and team leads, this is the one that actually drives action:
- The team’s total spend, daily granularity, 30-day view
- Top 5 services by cost within the team
- Cost anomalies: spikes and unexpected changes
- Untagged resource count
- Week-over-week delta
It should update daily and be reachable without asking anyone for access. An access request is enough friction to kill the habit before it forms.
For individual engineers, go one level deeper: service-level breakdown for their own services, resource-level detail naming the specific instances and clusters, idle resource detection, and right-sizing recommendations. Engineers want a table sorted by cost with an action next to each row, not a pie chart. The team view is what cost allocation in Xplorr is for: spend split by tag, team and account.
Why Do Dashboards Alone Change Nothing?
Here is the mistake that follows building all three: you announce them at an all-hands and assume people will look.
They will not.
Dashboards are passive. Alerts are active. The dashboard is reference material. The alert is what drives behavior. Every dashboard needs corresponding alerts: budget threshold exceeded, anomaly detected, new untagged resources found. The alert sends someone to the dashboard, and the dashboard gives them the context to act.
Without the alert, the dashboard is a page nobody visits, maintained by someone who eventually notices nobody visits it.
What Does a Monthly Cost Review Look Like?
A review that works has a strict format.
In the room: the FinOps lead or whoever owns cost visibility, as facilitator. One representative per engineering team, rotating rather than always the manager. A finance partner, for budget context, not to present. Optionally the platform lead.
Duration: 45 minutes, hard stop. Longer means you are covering too much.
Agenda:
- Total spend summary, 5 minutes. Month-over-month change, budget against actual, anomalies. Headline numbers only.
- Top 3 cost changes, 15 minutes. The three biggest absolute-dollar moves. For each: what changed, why, whether it was expected. This is where most of the value is. A $4,000 jump in NAT Gateway costs tells you more than reviewing every line item.
- Team spotlight, 15 minutes. One team presents what they spent, what they optimized, what is planned. Rotate so each team appears every two to three months.
- Action items, 10 minutes. “Platform team will evaluate VPC endpoints for the data pipeline subnets by 30 March” is an action item. “We should look into cost optimization” is not.
What Kills a Cost Review?
Four things, all of them recoverable if you notice them early:
- Running past 45 minutes. Attention collapses and the action items at the end get rushed
- Fifty slides of charts nobody asked for. Charts are for the dashboard. The meeting is for decisions
- No action items. Information sharing with no follow-up trains everyone that the meeting is optional
- Only finance presenting. Engineers tune out, and the people who can actually change the numbers stop attending
The team spotlight is the format’s real engine. When one team explains how they moved S3 and ECR traffic off the NAT Gateway and onto VPC endpoints, every other team paying NAT processing fees for the same traffic finds out they can too.
Where Should FinOps Sit in Your Org?
It depends on headcount. A reasonable default at each stage:
Under 100 engineers: the platform team. No dedicated FinOps person needed. Add cost visibility to the platform team’s remit, since they already own infrastructure tooling. The risk is that cost work gets deprioritized behind a Kubernetes upgrade or a security incident, so make the cost review a standing meeting rather than a when-we-have-time activity.
100 to 500 engineers: one FinOps engineer, embedded in platform. One person whose primary job is cloud cost, sitting with the platform team. They own dashboards, run the monthly review, partner with finance on budgeting, and work with teams on specific projects. This person should be an engineer rather than a finance analyst. They need to discuss Kubernetes resource requests, database indexing and CDN caching credibly.
500-plus engineers: a FinOps team. A lead, two or three engineers, ideally a data analyst. They operate as an internal consultancy, each engineer embedded with a set of product teams.
Report the team to the VP of Engineering or CTO, not to Finance. Reporting into Finance makes FinOps read as cost police rather than engineering partners, and the best teams feel like they are on your side.
Where Do FinOps Programs Go Wrong?
Tagging everything and acting on none of it. High tagging compliance feels like progress and is worth nothing alone. If no decision anywhere changes because of a tag, tags without dashboards and dashboards without alerts are just metadata.
Optimizing before understanding. Buying Reserved Instances because that is what you are supposed to do, before baselining spend or understanding usage patterns, is how you end up holding reservations for instance types you stopped running.
Treating it as a quarterly project. Cost optimization is a practice, not a project with an end date. The moment attention stops, costs drift back, because the decisions that create them keep being made whether or not anyone is watching.
What Else Goes Wrong?
Not connecting cost to business metrics. “We spent $47,000 on AWS this month” means nothing alone. “We spent $47,000, which is $0.12 per active user, down from $0.15 last quarter” is a story. Unit economics make the conversation legible to executives and engineers at the same time.
Treating every environment the same. Production needs reliability-focused decisions. Dev and staging need cost-focused ones. Running staging at production scale “just in case” doubles the cost of every capacity decision, and nobody is on call for staging.
Both mistakes share a root: measuring infrastructure against itself rather than against what the business is trying to do with it.
How Do You Start This Week?
Starting from zero, do not build the whole program. Do these four:
- This week: enable Cost Explorer (or the equivalent) and identify your top 5 line items. Just know what you are spending.
- Next week: implement 3 required tags and enforce them on new resources via SCP or Azure Policy. Do not backfill yet.
- Week 3: build one team-level dashboard showing daily spend by service. Send it to one team lead and ask whether it is useful.
- Week 4: run your first cost review. Thirty minutes. Top 3 cost changes only.
Four weeks to a functioning practice. It will not be perfect and does not need to be. It needs to create a feedback loop between engineering decisions and their cost.
Everything else, comprehensive tagging, executive dashboards, unit economics, optimization projects, builds on that loop. Tools like Xplorr accelerate it with multi-cloud visibility, anomaly detection and team-level dashboards out of the box, but the tool does not matter if the practice is not there. Get the practice right first.
Keep reading
- Cloud Cost Optimization for Startups: A Guide by Stage
- Cloud Cost Monitoring and Alerting: A Setup Guide
- AWS Cost Optimization Strategies That Actually Work
See how Xplorr helps → Features
Xplorr shows your AWS, Azure and GCP spend in one place, with anomaly detection, budgets and rightsizing recommendations. Get started free.
Written by
Xplorr team
The people who build Xplorr
Written together by the engineers who build Xplorr: the AWS, Azure, GCP and Kubernetes collectors, the console, and the alerting behind them.
About Xplorr