Report cloud emissions next to the spend that caused them
Emissions reporting usually lives in a spreadsheet that nobody can tie back to infrastructure. Xplorr pulls the carbon figures each provider publishes for your accounts, splits them by scope, service and region, and puts them beside the cost that generated them so the two can be read together.
Inputs
Where the Carbon numbers come from
Xplorr reads your accounts with read only credentials and never writes to your infrastructure. These are the sources behind this screen.
- Each provider's own carbon data
- The figures come from the carbon reporting AWS, Azure and GCP publish for your own accounts. Xplorr does not model emissions from instance hours, so the numbers match what the provider will tell an auditor.
- Your billed cost
- The same cost data behind the rest of Xplorr, which is what makes an intensity figure per unit of spend possible.
- Service and region metadata
- Emissions are attributed to the service and region they came from, because a region choice is usually the single largest lever on the number.
Method
How the Carbon numbers are worked out
No black box. If a figure is an estimate or an apportionment rather than a billed line, the page says so.
Emissions are split by scope
Scope 1, Scope 2 and Scope 3 are reported separately and stacked in the monthly chart, rather than collapsed into one total that cannot be used for reporting.
Scope 2 can be read market based or location based
The two methods answer different questions, one accounting for the energy contracts a provider has bought and the other for the grid the data centre physically sits on. You choose which basis the page reports, because your disclosure framework will specify one.
Carbon intensity is emissions divided by billed cost
Reported per unit of spend, which gives a ratio that stays comparable as the estate grows and makes two regions or two services directly comparable.
Reported monthly, because providers publish monthly
Provider carbon data is released on a monthly cycle and lags the billing data, so the series is monthly and the most recent month fills in later than the cost figures beside it.
Each provider needs its carbon export switched on first
Carbon data does not arrive with the ordinary cost sync, and it is configured per account. AWS needs a Data Exports carbon emissions table delivered to S3 as CSV, with the account role allowed to list that bucket and read that prefix. Azure needs the Carbon Optimization Reader role on each subscription you want counted. GCP needs the Carbon Footprint BigQuery export and read access to the dataset it writes. Until one of those exists, the page is empty for that provider rather than estimated.
Only complete months are pulled, and recent ones are pulled again
The sync runs once a month and fetches the last complete months, so the month in progress never appears at all. It refetches the three most recent complete months on each run, because providers publish a month part way through the next one and then revise it. A figure you read this month can legitimately be different next month.
Location based Scope 2 is not available from every provider
AWS and GCP publish Scope 2 on both the market based and the location based method. Azure publishes the market based figure only. Switching the page to location based therefore shows nothing for Azure accounts, and a mixed estate will not produce a complete location based total. AWS also reports its Scope 3 on the market based method.
In the console
What is on the Carbon screen
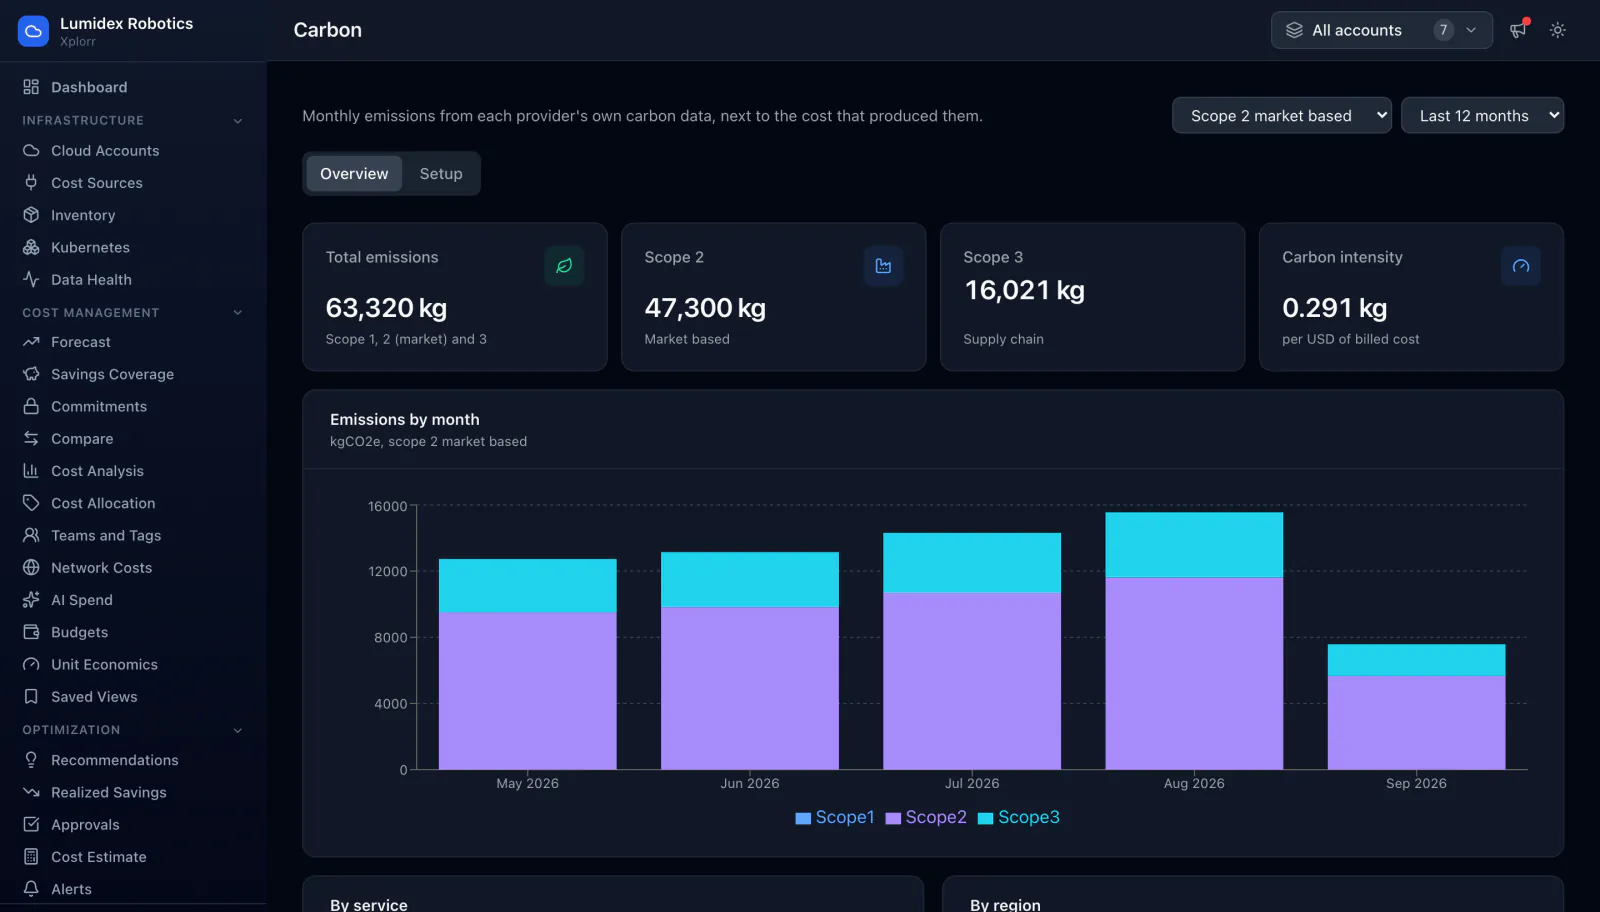
- Total emissions across Scope 1, Scope 2 and Scope 3 in kilograms of CO2 equivalent
- Scope 2 and Scope 3 as their own figures, with the basis stated
- Carbon intensity per unit of billed cost
- Monthly stacked chart of emissions by scope over the last 12 months
- Breakdown by service and by region
- A choice of market based or location based Scope 2, and a setup tab for configuring sources
Common questions about Carbon
Are these figures estimated?
Should I report market based or location based Scope 2?
Why is the latest month lower than the others?
How long after connecting an account do emissions appear?
Which accounts and subscriptions are counted?
Why is carbon intensity blank for a month?
Background reading
Why a location based carbon figure is empty for Azure while AWS and GCP report both methods is explained in What building cloud cost integrations teaches you.
Related features
How this compares
See this on your own accounts
Connect a cloud account with read only credentials and the first sync pulls your last 30 days, so this screen fills with your numbers instead of the demo workspace. Free during beta.