Split cluster cost by namespace, workload and label
A Kubernetes node arrives on the bill as one instance, no matter how many teams share it. Xplorr connects to OpenCost in your cluster, gathers per workload CPU, memory, GPU, storage and network metrics, and uses them to divide that node cost across namespaces, controllers, pods and labels.
Inputs
Where the Kubernetes numbers come from
Xplorr reads your accounts with read only credentials and never writes to your infrastructure. These are the sources behind this screen.
- OpenCost in your cluster
- Xplorr reads allocation data from OpenCost, the CNCF project for Kubernetes cost monitoring, rather than computing it itself. The recommended path is one Helm command: it installs OpenCost and a collector that sends cost data out over outbound HTTPS, so a private cluster stays closed with nothing exposed. If OpenCost already runs somewhere Xplorr can reach, point Xplorr at that endpoint instead and skip the collector; Xplorr then calls it on a schedule. OpenCost is open source under Apache 2.0 and is not affiliated with Xplorr. opencost.io
- Your cloud bill
- Node cost comes from the same billing data as the rest of Xplorr, so the cluster is priced from what you were actually charged for those instances, including any commitment discount already applied.
- Workload metadata
- Namespace, controller, pod and label come from the cluster itself, which is what makes a label like team or env usable as a cost dimension.
Method
How the Kubernetes numbers are worked out
No black box. If a figure is an estimate or an apportionment rather than a billed line, the page says so.
Node cost is spread across the workloads on it
Each workload is charged for the CPU, memory, GPU, storage and network it requested or used over each window. Those shares are what turn one instance line on the invoice into a per namespace figure.
Idle capacity is reported, not hidden
Whatever a node cost that no workload accounted for is shown as idle cost, with its share of the cluster total. This is the number that tells you the cluster is overprovisioned, so Xplorr keeps it visible instead of spreading it silently over every team.
Shared cost gets its own column
Cost that belongs to the cluster rather than to any one workload appears in a shared column next to the resource columns, so a namespace total shows both what it consumed directly and what it carries.
Allocation coverage tells you how much is explained
Coverage is the share of the linked compute bill that cluster allocation accounts for. A low number means most of your compute is outside these clusters, which is useful context before anyone treats the cluster view as the whole picture.
In the console
What is on the Kubernetes screen
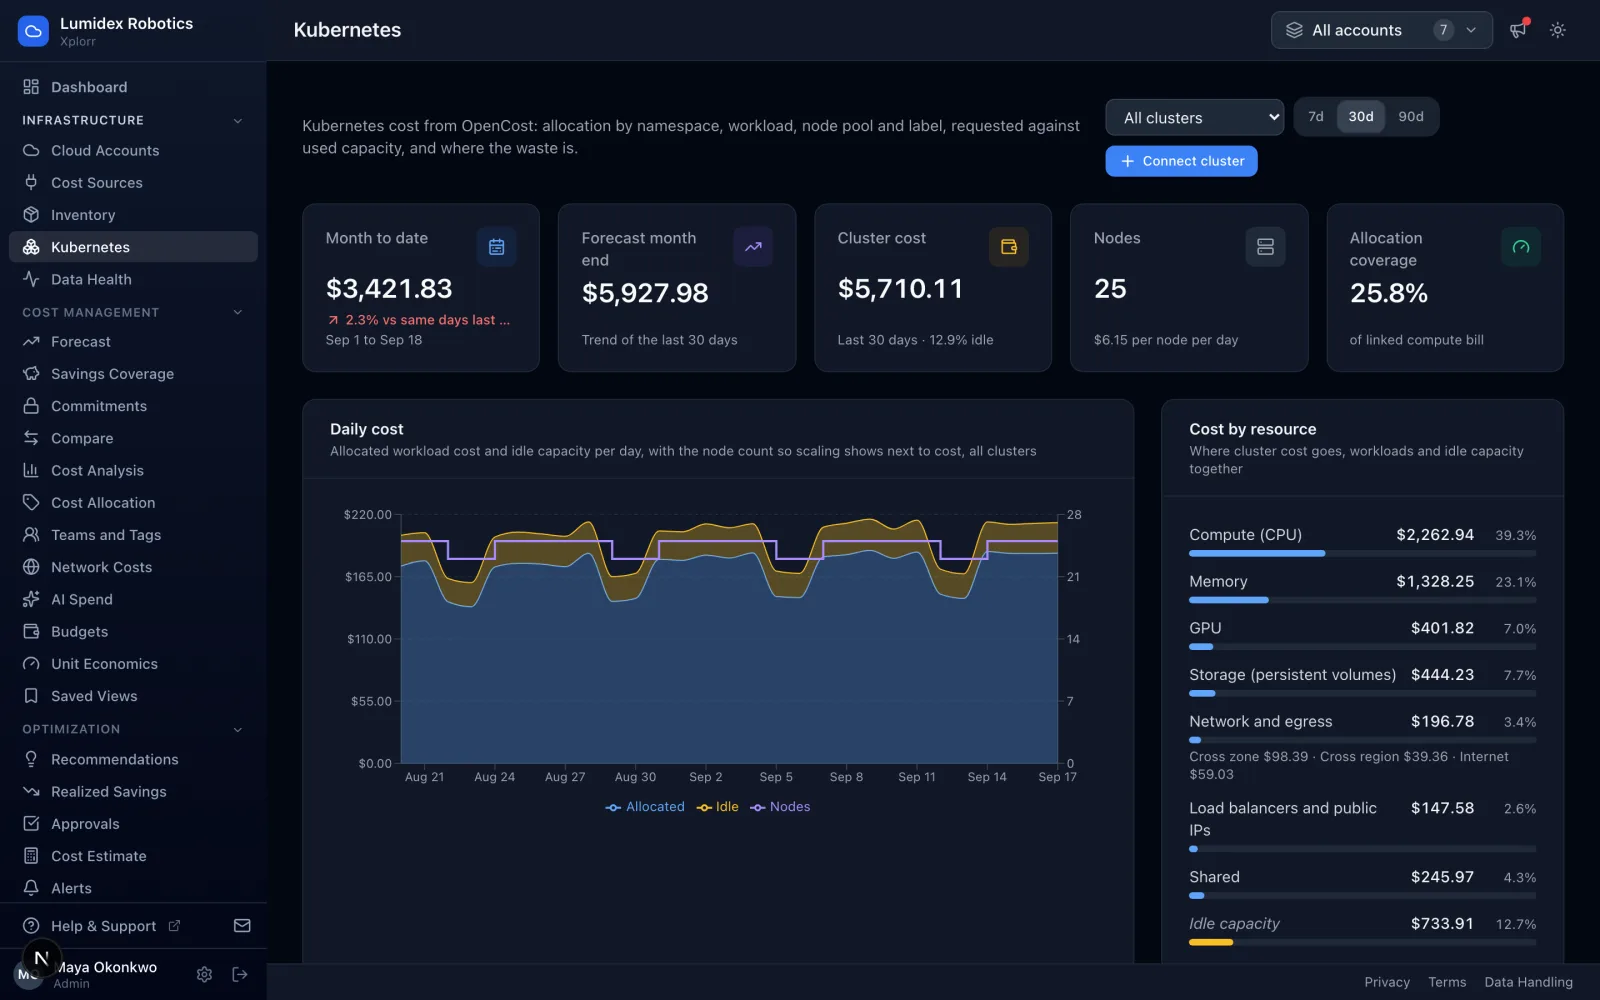
- Cluster cost, idle cost and idle as a percentage of the cluster total
- Number of connected clusters and allocation coverage against the linked compute bill
- Daily chart of allocated workload cost against idle capacity across all clusters
- Cost breakdown switchable between namespace, controller, pod and label
- CPU, RAM, GPU, storage, network and shared cost as separate columns per row
- Each row total with its share of cluster spend, and filters for cluster and 7, 30 or 90 days
Common questions about Kubernetes
Does this need an agent installed in my cluster?
Does it work on EKS, AKS and GKE?
Why is idle cost shown separately instead of shared out?
What is allocation coverage?
Background reading
The Kubernetes cost optimization guide covers requests, limits, idle node capacity and namespace allocation in more depth.
If you are choosing a tool for cluster cost specifically, see Kubernetes cost monitoring, which covers the OpenCost setup end to end.
Related features
How this compares
See this on your own accounts
Connect a cloud account with read only credentials and the first sync pulls your last 30 days, so this screen fills with your numbers instead of the demo workspace. Free during beta.