AWS cost anomaly detection that judges every service against itself
Xplorr reads your daily AWS cost with read only credentials and compares each service, in each account and region, with its own average over the previous seven days. When a day runs well above that line, the alert lands in Slack and email with the actual and baseline cost side by side. The same detection covers Azure and GCP if you connect them.
Inputs
Where the AWS anomaly numbers come from
Xplorr reads your accounts with read only credentials and never writes to your infrastructure. These are the sources behind this screen.
- Daily AWS cost by service, account and region
- Read from the Cost Explorer API (GetCostAndUsage) with an IAM user or an assumed role limited to read actions. Detection runs on billed cost, so every alert corresponds to money. AWS permissions
- The recent history of that same series
- The baseline for EC2 in one account and region is built from EC2 in that account and region, so a service that costs a few dollars a day is never judged against one that costs thousands.
- CloudTrail events, for root cause
- Evidence based root cause reads CloudTrail LookupEvents around the day of the spike. It is rolling out to selected organizations and is not generally available yet.
Method
How the AWS anomaly numbers are worked out
No black box. If a figure is an estimate or an apportionment rather than a billed line, the page says so.
A baseline per service, account and region
Each day is compared with the average of the previous seven days for the same series. There is no single threshold for the whole bill to tune.
A spike has to be large and worth money
A day must run more than 50% above its baseline to count, and a change of a few cents on a service that costs under a dollar a day is ignored, so small services do not flood the queue.
Severity follows the size of the jump
An increase of 50% is graded low, a doubling medium, a tripling high and a sixfold jump critical, so a wobble and a runaway do not arrive looking the same.
The alert goes where people read
New anomalies are posted to your connected Slack workspace and emailed to the organization admins, each of whom can turn anomaly emails off in their own notification settings. A signed anomaly.created webhook is available for other tools.
Every anomaly has a status
Mark one as expected, optionally muting that series for up to 90 days, take it as investigating, or resolve it, so the open list only holds what still needs a look.
In the console
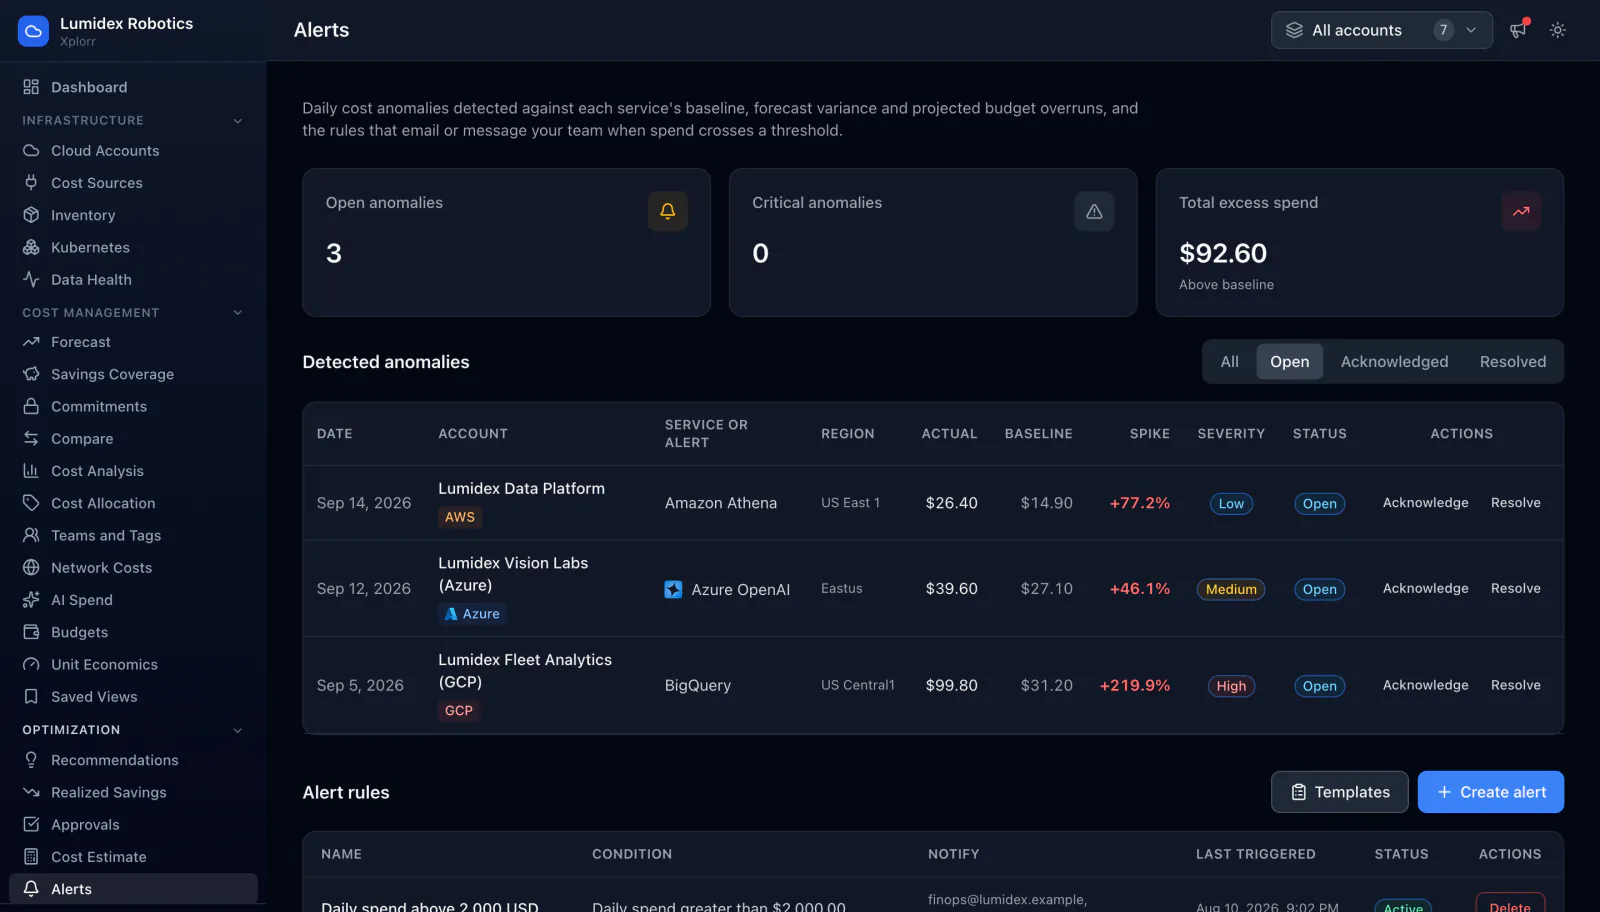
What is on the AWS anomaly screen
- Open anomalies, with the critical ones counted separately
- Total spend above baseline across everything still open
- Account, service and region for each anomaly
- Actual cost against baseline cost, with the spike as a percentage
- A short AI summary written from the last 14 days of that series
- Expected, investigating and resolve actions on each row
Common questions about AWS anomaly
How is this different from AWS Cost Anomaly Detection?
How quickly does an anomaly show up?
Does it tell me what caused the spike?
What access does Xplorr need in my AWS account?
What does it cost?
Background reading
What counts as an anomaly, and what a runaway Lambda or an accidental cross region transfer looks like in the data, is covered in What is a cloud cost anomaly.
To set up the native AWS service alongside budgets and forecasted alerts, follow the cloud cost monitoring and alerting guide.
Related features
How this compares
See this on your own accounts
Connect a cloud account with read only credentials and the first sync pulls your last 30 days, so this screen fills with your numbers instead of the demo workspace. Free during beta.