What Is a Cloud Cost Anomaly (And Why You Should Care)
A cloud cost anomaly is an unexpected deviation from your spend baseline. How anomaly detection works, and what a runaway function looks like in the data.

Xplorr team
The people who build Xplorr
In this post
A cloud cost anomaly is any unexpected, statistically significant deviation in your cloud spending from its established baseline. In plain terms: when a service suddenly costs a lot more than it normally does, and you didn’t expect that to happen.
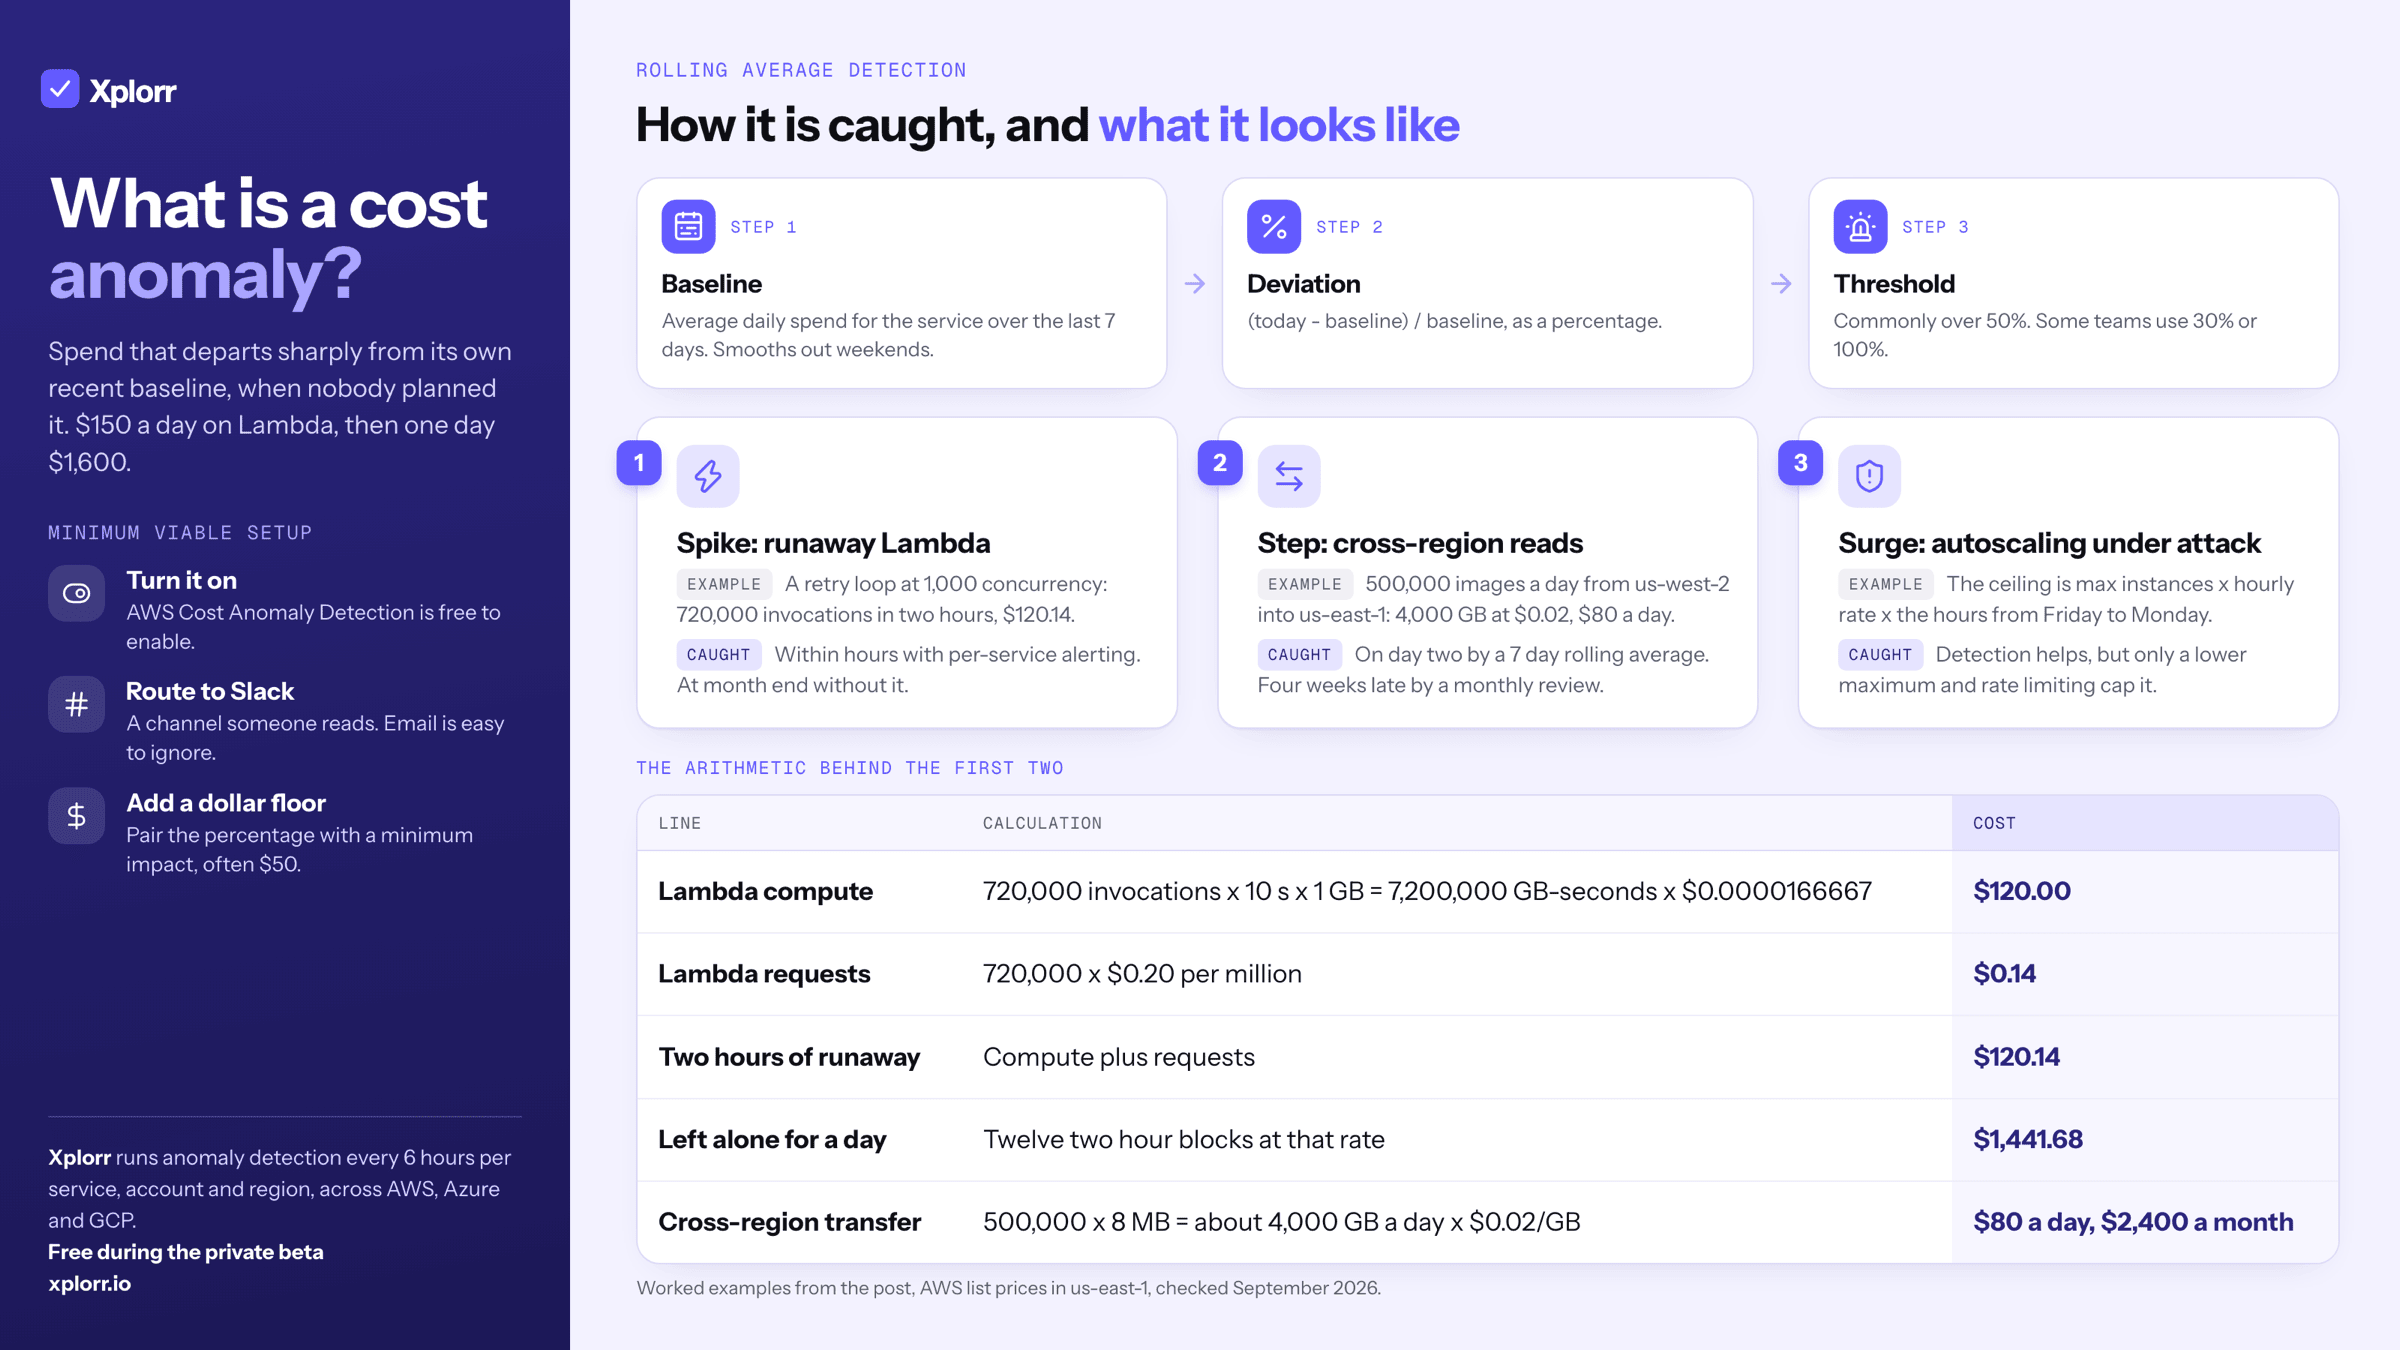
The word “anomaly” sounds technical. The concept is simple. You spend roughly $150/day on Lambda. One day you spend $1,600. That’s an anomaly.
How Rolling Average Detection Works
The most reliable method for detecting anomalies in cloud costs is comparing current spend against a rolling average of recent spend. Here’s the mechanics:
- Calculate the baseline: Take daily spend for a given service over the past 7 days and compute the average. This becomes the expected spend for today.
- Measure the deviation: Compare today’s actual spend against that baseline. Express it as a percentage.
- Apply a threshold: If the deviation exceeds a defined threshold (commonly 50%), flag it as an anomaly.
Why 7 days? Long enough to smooth out normal day-of-week variation (most services spend less on weekends). Short enough to adapt to legitimate step changes in your usage, like a new feature launch that permanently increases compute spend.
Why 50%? High enough to avoid false positives from normal variance, low enough to catch real problems before they compound. Some teams set it lower (30%) or higher (100%) depending on their tolerance for noise.
The math for a given service on a given account:
rolling_avg = sum(daily_cost, last 7 days) / 7
deviation = (today_cost - rolling_avg) / rolling_avg * 100
if deviation > 50%: alert
AWS has native anomaly detection in Cost Explorer. It uses machine learning rather than a simple rolling average, which is more sophisticated but also more of a black box. You don’t always understand why it did or didn’t fire.
What Do Anomalies Look Like in the Data?
Anomalies fall into a few recurring shapes. The three worked examples below use AWS list prices in us-east-1, so you can run the same arithmetic against your own configuration and get a number you can defend.
What Does a Runaway Lambda Function Cost?
A bug in a client SDK sends a malformed event, the handler throws, and the function enters a retry loop. Nothing is broken enough to page anyone, and the cost curve goes vertical.
Take a Lambda function configured with 1 GB of memory that runs for 10 seconds per invocation. AWS charges $0.20 per million requests and $0.0000166667 per GB-second for x86 functions. At a few thousand invocations a day, that is pennies.
Now put it in a retry loop at the default 1,000 concurrent executions. At 10 seconds each, that is about 100 invocations a second, or 720,000 in two hours:
720,000 invocations x 10 s x 1 GB = 7,200,000 GB-seconds
7,200,000 x $0.0000166667          = $120.00
720,000 requests x $0.20 / 1M      =   $0.14
                                     -------
two hours of runaway                = $120.14
Prices checked September 2026, us-east-1.
Left alone, that is $1,441.68 a day from a service whose baseline was a rounding error. The account’s total spend looks unremarkable on day one, which is exactly why detection has to run per service rather than on the headline number.
Detection time with anomaly alerting: hours. Detection time without it: end of month.
What Does an Accidental Cross-Region Transfer Cost?
A pipeline is rebuilt and ends up reading assets from an S3 bucket in us-west-2 while the processing instances run in us-east-1. Cross-region transfer out of us-east-1 is $0.02/GB, which is not a scary number on its own.
Process 500,000 images a day averaging 8 MB each and it is 4 TB of cross-region transfer per day:
500,000 x 8 MB     = 4,000,000 MB = ~4,000 GB/day
4,000 GB x $0.02   = $80/day
$80 x 30           = $2,400/month
Prices checked September 2026, us-east-1.
This shape is a step change rather than a spike. Spend goes from near zero to a consistent elevated level and stays there. A detector comparing today against a 7-day rolling average catches it on the second day, then stops flagging it once the new level sits inside the window. A monthly review catches it four weeks late.
What Does an Autoscaling Group Under Attack Cost?
A volumetric attack hits an auto-scaling group behind an ALB on a Friday afternoon. The group scales out, every added instance bills by the hour, and the ALB bills for the request volume on top.
The number that matters is not what the attack costs while someone is watching. It is the autoscaling maximum, because that is the ceiling on what the attack can cost while nobody is.
Multiply your group’s maximum instance count by the hourly on-demand rate of the instance type and by the hours between Friday evening and Monday morning. If that number is uncomfortable, the maximum is set wrong. No amount of anomaly detection substitutes for lowering it and putting rate limiting in front.
Why Should You Care About Cost Anomalies?
Cost anomalies have two kinds of impact.
Direct financial impact. The obvious one. A Lambda runaway, a data transfer bug, or a forgotten autoscaling maximum costs real money, and the longer it runs undetected, the more it costs.
Indirect operational signal. Cost anomalies often surface operational problems before other signals do. A Lambda running 1,000x its normal invocation count is not just expensive, it is probably in an error loop that is also affecting users. A data transfer spike often means misconfigured routing. Treating cost as an observability signal gives you an early warning system that complements your application metrics.
How Do You Set Up Anomaly Detection?
The minimum viable setup:
- Enable AWS Cost Anomaly Detection (Cost Explorer → Anomaly Detection → Create monitor). Free to enable, alerts via email or SNS.
- Route alerts to Slack. Pick a channel someone actually reads. Email is too easy to ignore.
- Set thresholds thoughtfully. A $5 anomaly on a $10/month service is a 50% spike, but it is $5. Most teams pair the percentage threshold with a minimum dollar impact, commonly $50 or more.
For multi-cloud environments you need equivalent setup on Azure and GCP, or one tool that monitors all three and alerts consistently. Xplorr’s AWS, Azure, and GCP integrations cover this without per-provider configuration, so a single Slack channel carries anomalies from all three clouds in the same format. Anomaly detection explains how each service’s baseline is built, and if AWS is most of your bill, AWS cost anomaly detection compares it with the free AWS service.
The goal is not to alert on everything. It is to make sure that when something genuinely unusual happens to your spend, you find out within hours rather than weeks. See Xplorr’s anomaly detection and alerting features for the full picture, and get started free to try it on the Free plan.
Xplorr shows your AWS, Azure and GCP spend in one place, with anomaly detection, budgets and rightsizing recommendations. Get started free.
Keep reading
- 5 Signs Your Cloud Bill Is About to Spike
- Cloud Cost Monitoring and Alerting: A Setup Guide
- How to Cut Your AWS Bill in One Week: A Practical Checklist
See how Xplorr helps → Features
Written by
Xplorr team
The people who build Xplorr
Written together by the engineers who build Xplorr: the AWS, Azure, GCP and Kubernetes collectors, the console, and the alerting behind them.
About Xplorr