One queue for everything that should have woken somebody
Detection is only half the job. Alerts collects daily cost anomalies found against each service baseline, forecast variance and projected budget overruns into a single triage queue, alongside the rules that email or message your team when spend crosses a threshold you set.
Inputs
Where the Alerts numbers come from
Xplorr reads your accounts with read only credentials and never writes to your infrastructure. These are the sources behind this screen.
- Daily cost per service and account
- Both the anomaly baselines and the threshold rules run against the same daily cost data synced from AWS, Azure and GCP, so an alert and the cost page behind it never disagree.
- Each service own rolling baseline
- Anomalies are found by comparing a service on an account against its own recent history rather than a threshold you had to guess. A service that normally costs $30 a day and a service that normally costs $3,000 both get a baseline that fits.
- Budgets and forecasts
- A projected budget overrun becomes an alert before the budget is actually breached, which is the point of a projection. Forecast variance is treated the same way.
- Your notification destinations
- Each rule carries the addresses or channels it notifies, so the routing lives with the rule rather than in a global setting somebody has to remember to change.
Method
How the Alerts numbers are worked out
No black box. If a figure is an estimate or an apportionment rather than a billed line, the page says so.
A spike is measured against baseline, not a fixed number
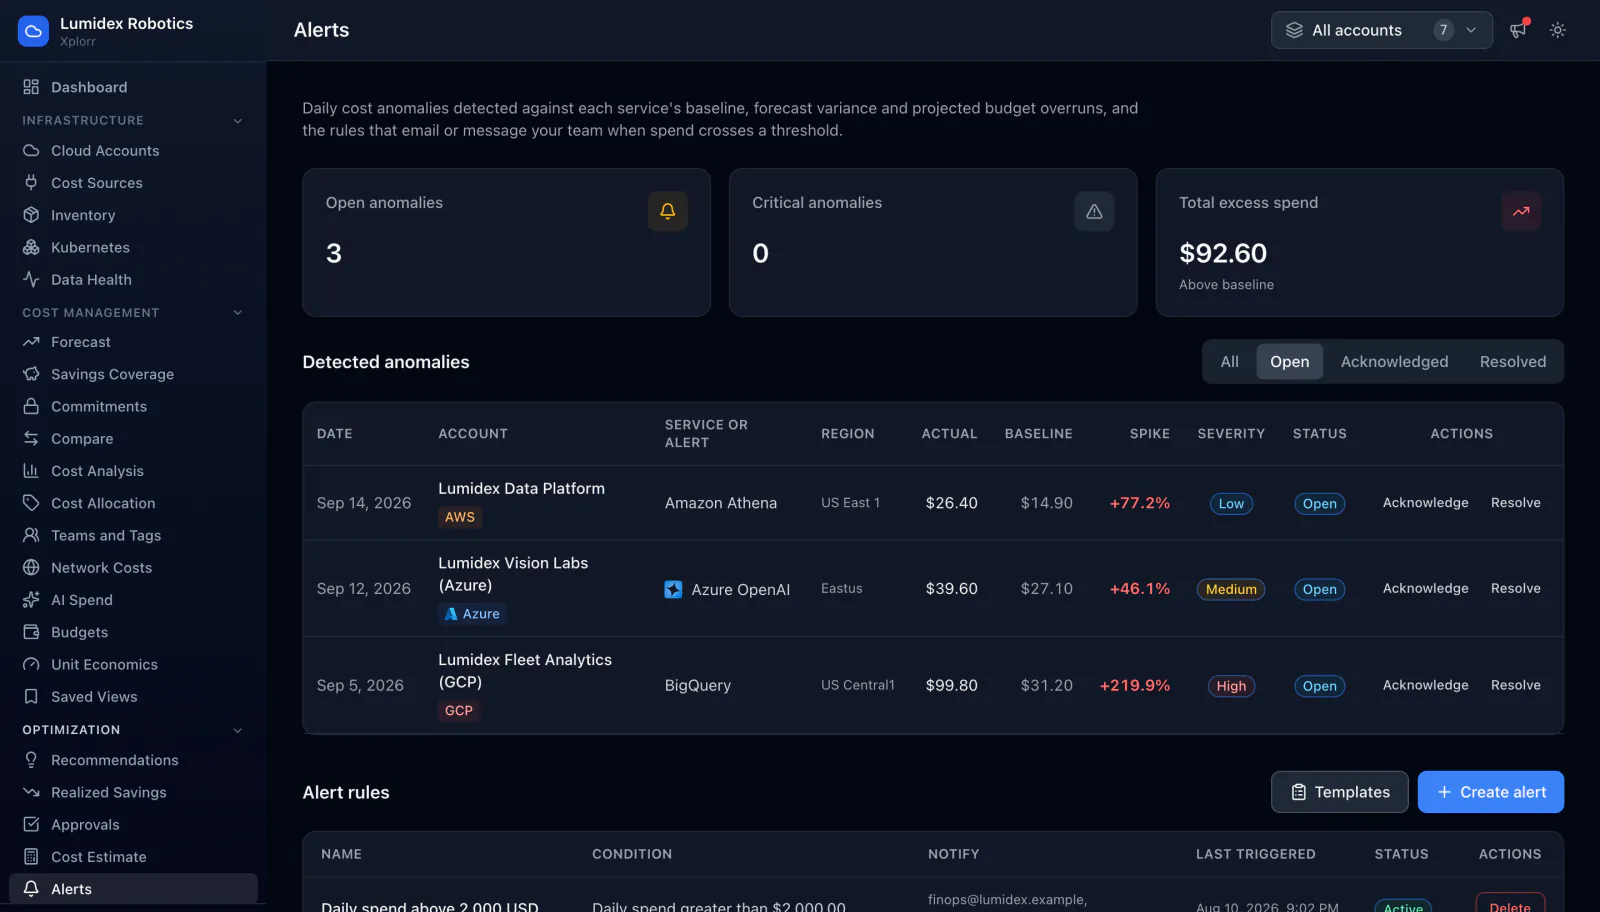
Each detected anomaly records the actual cost, the baseline it was compared against and the spike as a percentage above it. Because the comparison is per service and per account, no per service thresholds have to be maintained by hand.
Severity scales with the size of the overshoot
Anomalies are graded low, medium or high from how far above baseline they landed, so a queue can be worked in an order that reflects cost rather than the order things arrived.
Excess spend is totalled in currency
The page adds up how much the open anomalies cost above their baselines. A count of open alerts says how busy the queue is, and only the currency figure says whether it matters.
Rules are separate from detection and say exactly what they watch
A rule states its condition in plain terms, such as daily spend greater than a set amount, along with who it notifies and when it last fired. Baseline detection catches what you did not think to watch, and rules catch the specific number you already care about.
Every alert has a lifecycle
An anomaly can be acknowledged, meaning somebody is on it, or resolved, meaning it is dealt with or was expected. Without those states an alert list becomes a wall nobody reads.
In the console
What is on the Alerts screen
- Open anomalies, critical anomalies and total excess spend above baseline
- A detected anomaly table with date, account, service and region
- Actual cost against baseline cost, and the spike as a percentage
- Severity and status per anomaly, with acknowledge and resolve actions
- Filters for all, open, acknowledged and resolved
- An alert rules table with the condition, who it notifies, last triggered and whether it is active
- Rule templates and a control to create a new rule
Common questions about Alerts
How is this different from the Anomaly Detection page?
Do I have to set a threshold for every service?
Where do alerts get delivered?
What happens to an anomaly I resolve?
Background reading
The cloud cost monitoring and alerting guide walks through graduated budget thresholds, forecasted alerts and routing each severity to someone who can act, with the native AWS, Azure and GCP commands.
Related features
How this compares
See this on your own accounts
Connect a cloud account with read only credentials and the first sync pulls your last 30 days, so this screen fills with your numbers instead of the demo workspace. Free during beta.