A forecast that shows its working and its track record
A projected number is only worth acting on if you know how it was produced and how wrong it has been before. Xplorr fits a linear regression over the last 90 complete days, projects it to month end and 60 days out, shows the daily slope it derived, and then reports how its own past forecasts compared against what actually landed.
Inputs
Where the Forecasting numbers come from
Xplorr reads your accounts with read only credentials and never writes to your infrastructure. These are the sources behind this screen.
- The last 90 complete days of spend
- Only complete days are used. A partial day at the end of the window would drag the fit downward and make every projection read low.
- Daily cost across all connected accounts
- The same synced billing data as the rest of Xplorr, so a forecast covers AWS, Azure, GCP and model spend together rather than one cloud at a time.
- Previously issued forecasts
- Past projections are retained so they can be scored against the actual figure once it is known, which is what makes an accuracy claim checkable.
Method
How the Forecasting numbers are worked out
No black box. If a figure is an estimate or an apportionment rather than a billed line, the page says so.
A linear regression is fitted over the window
The method is stated rather than described as intelligence. A straight line through 90 days of daily spend is a reasonable model for infrastructure cost, and it is one you can sanity check by eye against the chart.
The daily slope is reported alongside the total
The projection comes with the trend it was derived from, expressed as an amount per day. A month end number tells you where you land, and the slope tells you how fast you are getting there.
Two horizons are projected
Month end, for the budget conversation happening now, and 60 days out, for the one about capacity and commitments.
Accuracy is measured at 1, 7 and 30 days ahead
Past forecasts are compared against actual spend at each horizon. Accuracy degrades the further out you look, and publishing that is more useful than implying it does not.
A linear fit has limits, and they are predictable
A straight line does not anticipate a launch, a migration or a commitment purchase. For a steady estate it is accurate and inspectable, which is the trade being made.
In the console
What is on the Forecasting screen
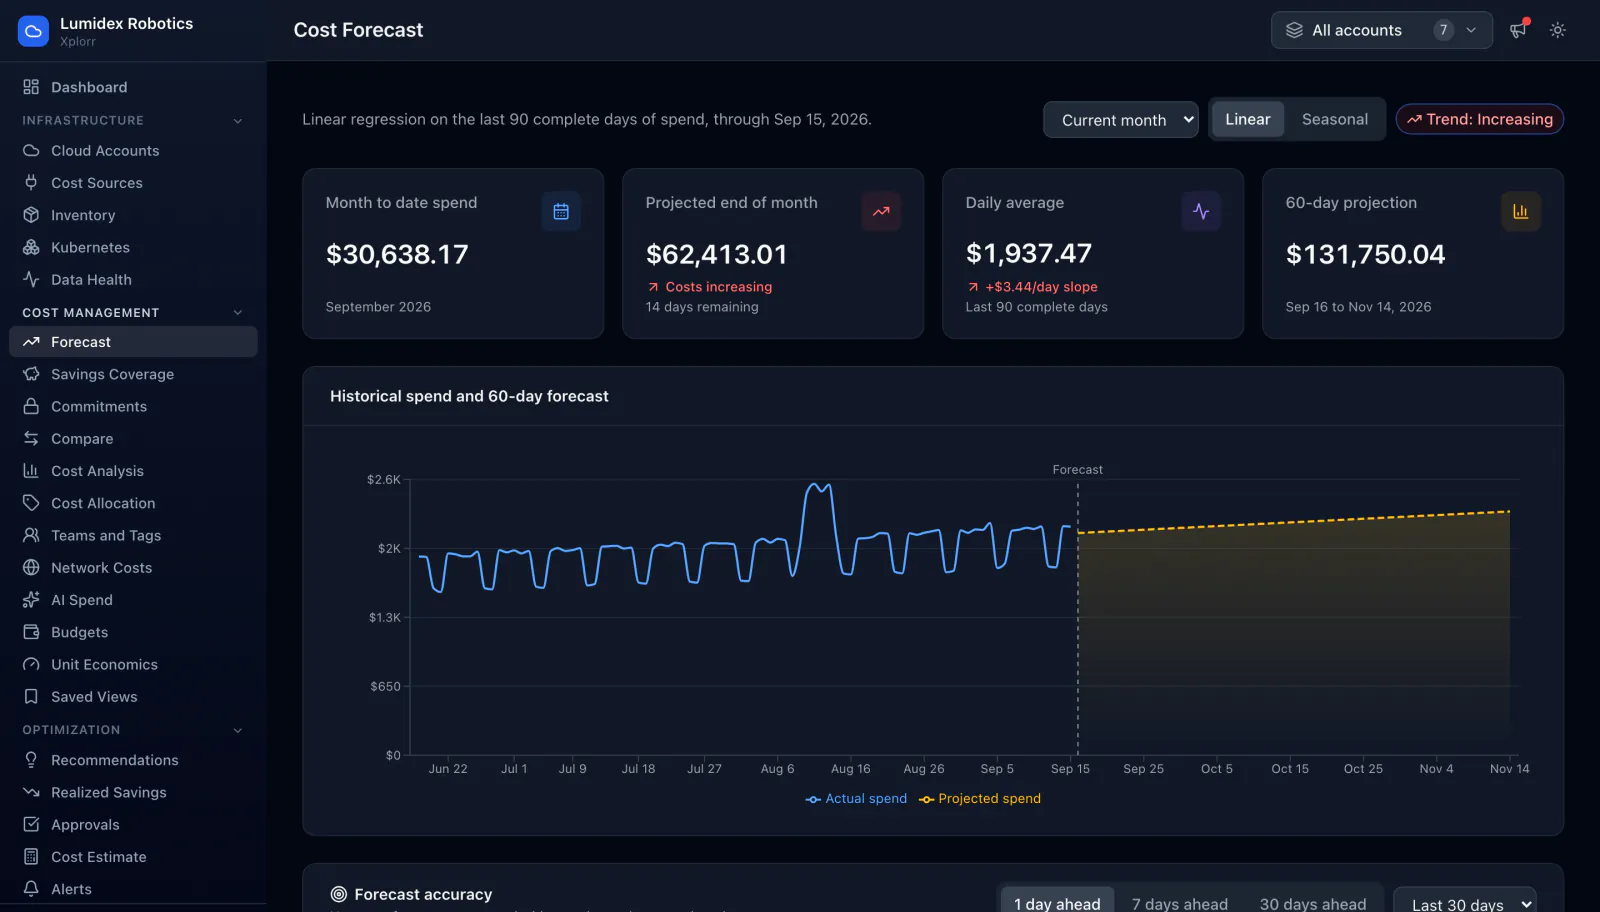
- Month to date spend against a projected end of month figure
- Daily average spend with the amount it is rising or falling each day
- A 60 day projection
- Actual spend and the projection charted together, with the projection dashed
- Reported forecast accuracy at 1, 7 and 30 days ahead, measured on complete days
- A choice between the linear model and a seasonal one
- A month selector and a trend label on the header
Common questions about Forecasting
Why a linear regression rather than a machine learning model?
How accurate is it?
Will it account for a migration we have planned?
Background reading
How a forecasted threshold gives you days to act instead of a post mortem is covered in the cloud cost monitoring and alerting guide.
Related features
How this compares
See this on your own accounts
Connect a cloud account with read only credentials and the first sync pulls your last 30 days, so this screen fills with your numbers instead of the demo workspace. Free during beta.