Split the bill by team, and admit what does not split
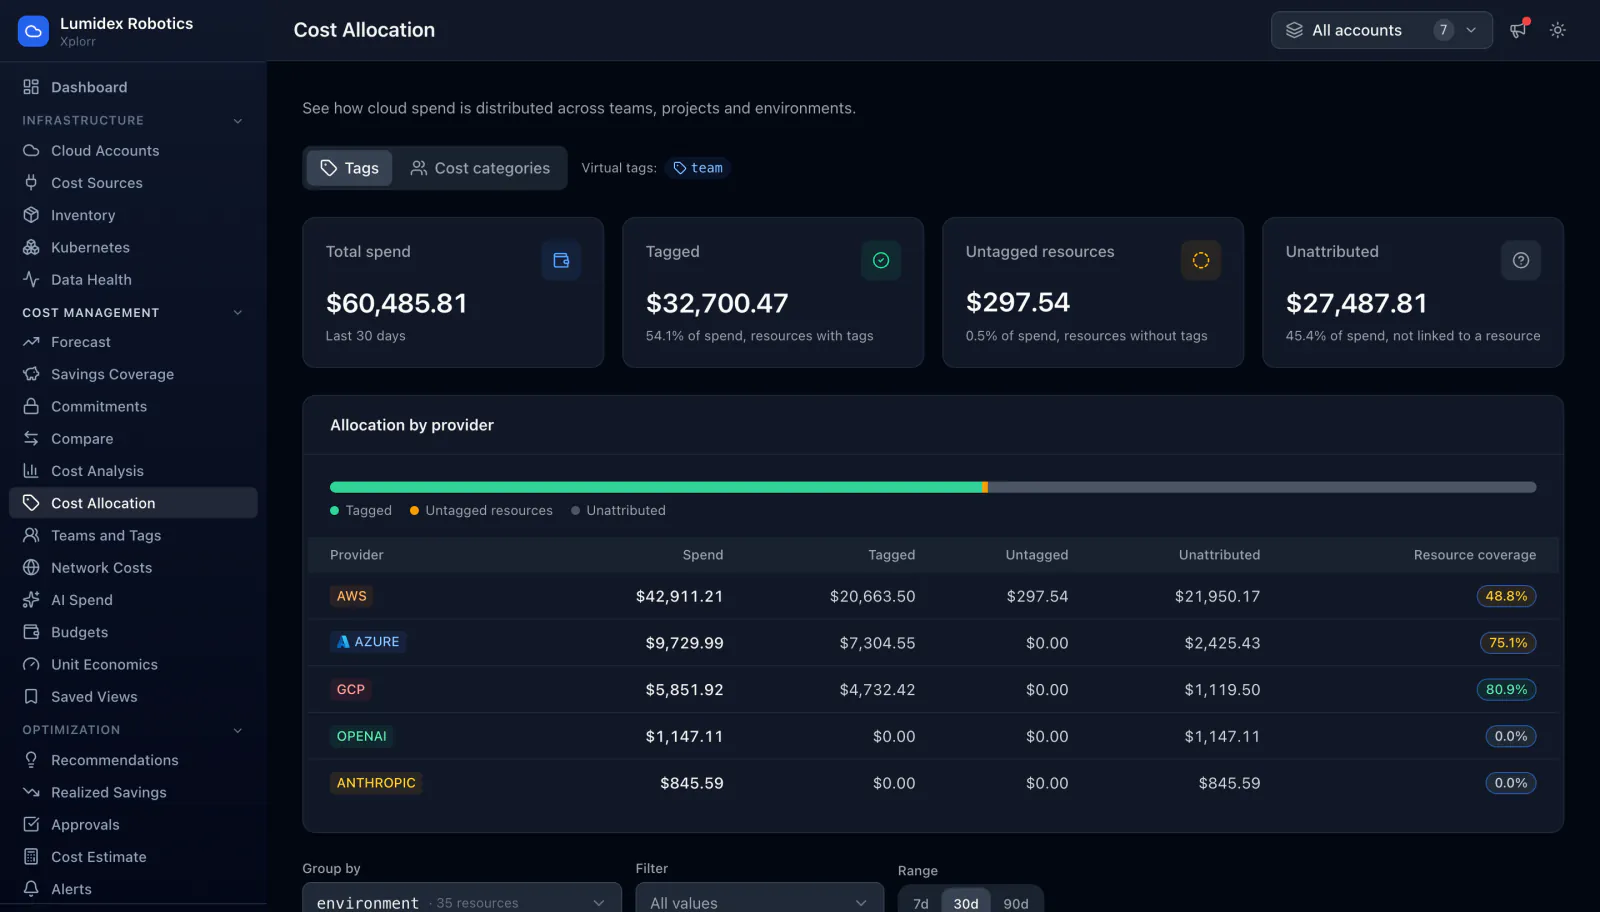
Allocation tools tend to report a tidy pie chart and quietly drop whatever did not fit. Xplorr splits spend across teams, projects and environments using the tags you already have, then shows the rest of the picture: what is untagged, what cannot be attributed to a resource at all, and what tag coverage looks like per provider.
Inputs
Where the Cost Allocation numbers come from
Xplorr reads your accounts with read only credentials and never writes to your infrastructure. These are the sources behind this screen.
- Cost allocation tags
- Tags are synced from AWS, Azure and GCP alongside the billing data, so allocation uses the labels your teams already apply rather than a taxonomy maintained separately in another tool.
- Billed cost per line item
- Allocation runs on usage level cost from Cost Explorer, Azure Cost Management and the GCP billing export, which is what allows a charge to be traced back to a resource.
- Resource inventory
- Used to work out tag coverage, because knowing the share of spend that is tagged requires knowing which resources exist and which of them carry a tag.
Method
How the Cost Allocation numbers are worked out
No black box. If a figure is an estimate or an apportionment rather than a billed line, the page says so.
Spend is grouped by tag value
A tag such as team, project or environment becomes a dimension, and spend is grouped by its values. Because tags come from the providers, a resource retagged today is allocated correctly from then on.
Untagged and unattributed are counted separately
These are different problems. Untagged spend belongs to a resource that has no tag, which someone can fix by tagging it. Unattributed spend never mapped to a resource in the first place, which no amount of tagging discipline will resolve.
Tag coverage is reported per provider
Coverage is shown as a percentage per provider, because tagging practice is rarely uniform across three clouds and an aggregate figure hides the account that is dragging it down.
The gap is never silently redistributed
Unallocated cost is not spread across teams to make the numbers add up. A chargeback built on a silent redistribution is one that falls apart the first time a team audits it.
In the console
What is on the Cost Allocation screen
- Total spend for the period with the tagged amount and its percentage
- Untagged spend and unattributed spend as separate figures
- Allocation table broken down per provider
- Resource coverage percentage per provider
- Grouping by team, project, environment or any other tag in use
- Filters by account, provider and date range
Common questions about Cost Allocation
What is the difference between untagged and unattributed?
Do I need a tagging policy before this is useful?
Can I do chargeback with this?
Background reading
Why allocation depends on tags people actually keep, and how to make them stick, is covered in FinOps best practices for engineering teams.
Related features
How this compares
See this on your own accounts
Connect a cloud account with read only credentials and the first sync pulls your last 30 days, so this screen fills with your numbers instead of the demo workspace. Free during beta.