Kubernetes cost monitoring next to the cloud bill that pays for it
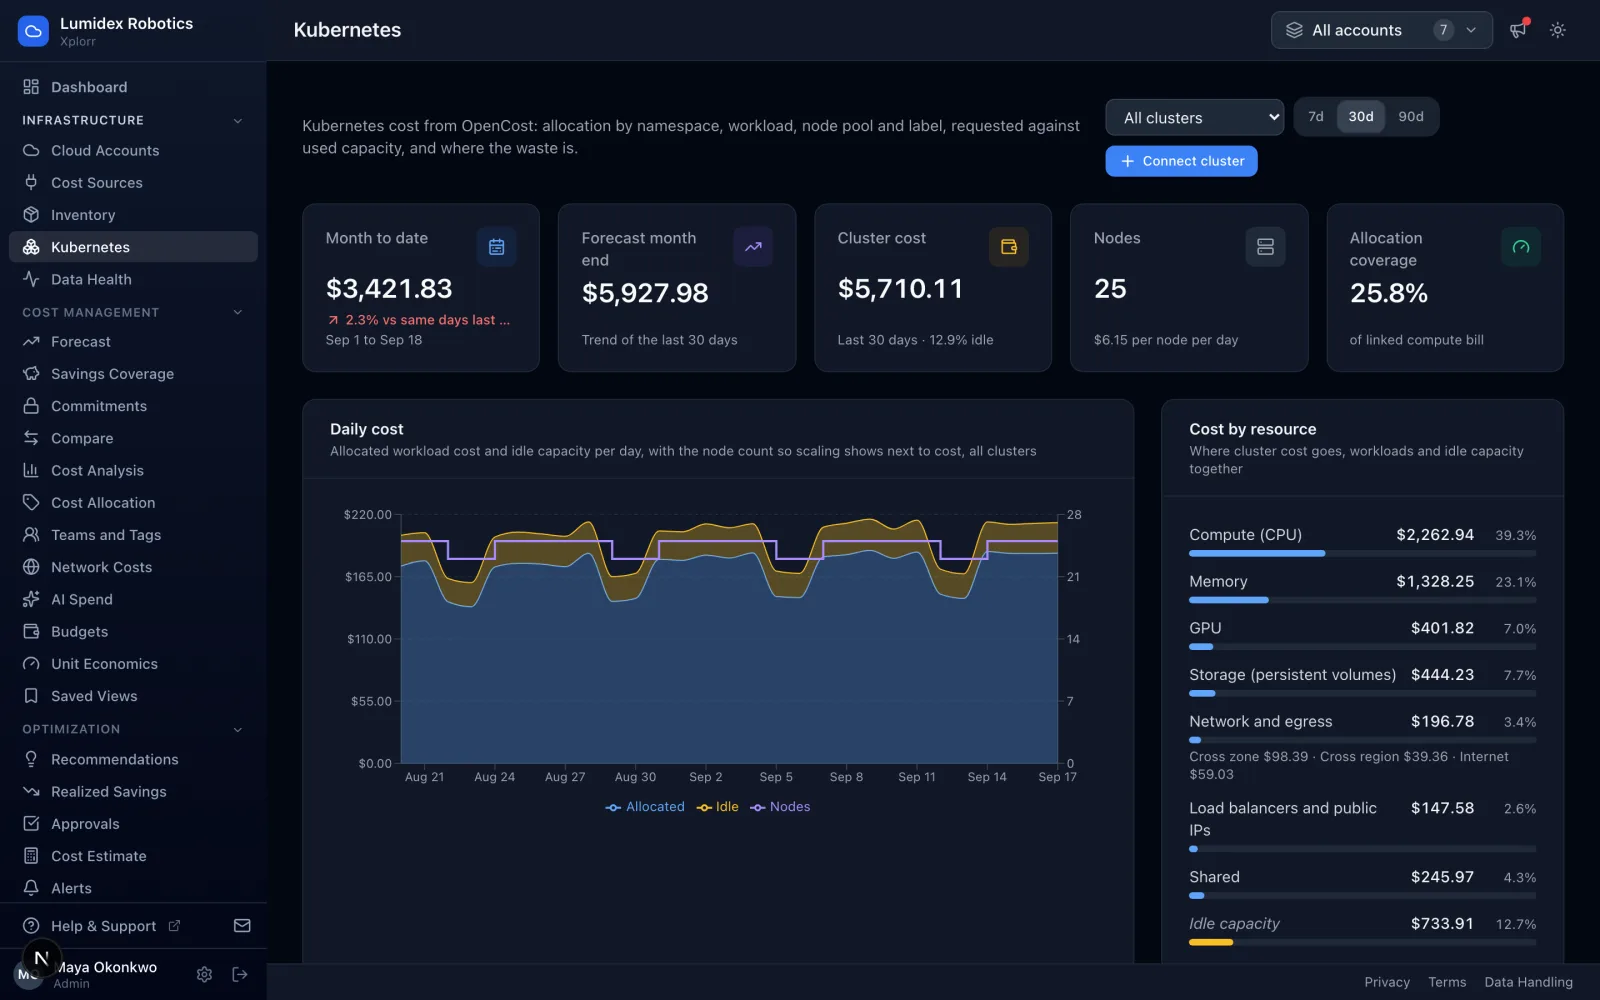
One Helm chart installs OpenCost and a small collector that sends allocation data to Xplorr every hour over outbound HTTPS. You get cluster cost by namespace, workload, label and node, idle capacity kept apart, and requested against used for every workload with a suggested lower request, in the same console as your AWS, Azure and GCP spend.
Inputs
Where the Kubernetes cost numbers come from
Xplorr reads your accounts with read only credentials and never writes to your infrastructure. These are the sources behind this screen.
- OpenCost allocation data
- Cost per namespace, controller, pod and label from the OpenCost allocation API, including average requested and used CPU and memory and the peak usage per pod. OpenCost
- OpenCost node assets
- Node and node pool cost, with node pools recognized from EKS node groups, AKS agent pools, GKE node pools and Karpenter labels.
- A write only token per cluster
- In the default push mode a CronJob in your cluster posts the data out, using a token that can only write data for that one cluster. Xplorr holds no cluster credentials and never calls the Kubernetes API. Setup guide
Method
How the Kubernetes cost numbers are worked out
No black box. If a figure is an estimate or an apportionment rather than a billed line, the page says so.
Allocation comes from OpenCost as it is
Namespace, workload and label totals are the numbers OpenCost reports. OpenCost prices nodes at public on demand rates unless you configure its cloud pricing.
Idle stays idle
Capacity no pod requested is shown as its own row rather than spread across namespaces, so a team is not charged for headroom it never asked for.
Requested against used, per workload
The cost of unused requests is the workload cost multiplied by the share of its request that went unused, which is the part a lower request would free.
A suggested request from observed peaks
The suggestion is the highest per pod usage OpenCost saw, plus 10% headroom. Where no peak is reported it falls back to average usage plus 50% and marks the figure as based on the average. It never suggests raising a request.
Hourly, with a short look back
The collector runs every hour and resends the last three days, so late data from OpenCost is corrected rather than lost. Only whole UTC days are shown.
In the console
What is on the Kubernetes cost screen
- Cost by namespace, controller, pod, label, node and node pool
- CPU, memory, GPU, storage, network and shared cost per row
- Idle cost as its own line, never spread across teams
- Efficiency by namespace and the cost of unused requests
- Over provisioned workloads with a suggested request and the monthly cost it would free
- Unused persistent volumes and the spot against on demand split of your nodes
Common questions about Kubernetes cost
How do I install it?
I already run OpenCost. Do I need a second one?
Which clusters does it work with?
Can I set budgets or alerts on cluster cost?
What does it cost?
Background reading
Why clusters bill for requests rather than usage, and how to close the gap safely, is covered in the Kubernetes cost optimization guide.
Over provisioned clusters sit next to NAT gateways and log ingestion in Hidden cloud costs you are missing.
Related features
How this compares
See this on your own accounts
Connect a cloud account with read only credentials and the first sync pulls your last 30 days, so this screen fills with your numbers instead of the demo workspace. Free during beta.