Hidden Cloud Costs You're Probably Missing Right Now
Cloud costs that hide in plain sight: NAT Gateway processing, cross-AZ transfer, idle load balancers, oversized Kubernetes and log ingestion, at list price.

Xplorr team
The people who build Xplorr
In this post
- What Does Cross-AZ Traffic Cost?
- Why Does CloudFront Charge You Twice?
- When Does VPC Peering Start Costing Money?
- Why Is NAT Gateway So Expensive?
- What Does NAT Data Processing Add Up To?
- How Do You Cut NAT Gateway Costs?
- Why Are Kubernetes Clusters Over-Provisioned?
- What Does Over-Provisioned Kubernetes Cost?
- How Do You Right-Size Pod Requests?
- What Do Idle Load Balancers Cost?
- What Does CloudWatch Log Ingestion Cost?
- What Does Secrets Manager Cost Per Secret?
- How Do You Find Hidden Costs Systematically?
- Why Do These Costs Stay Hidden?
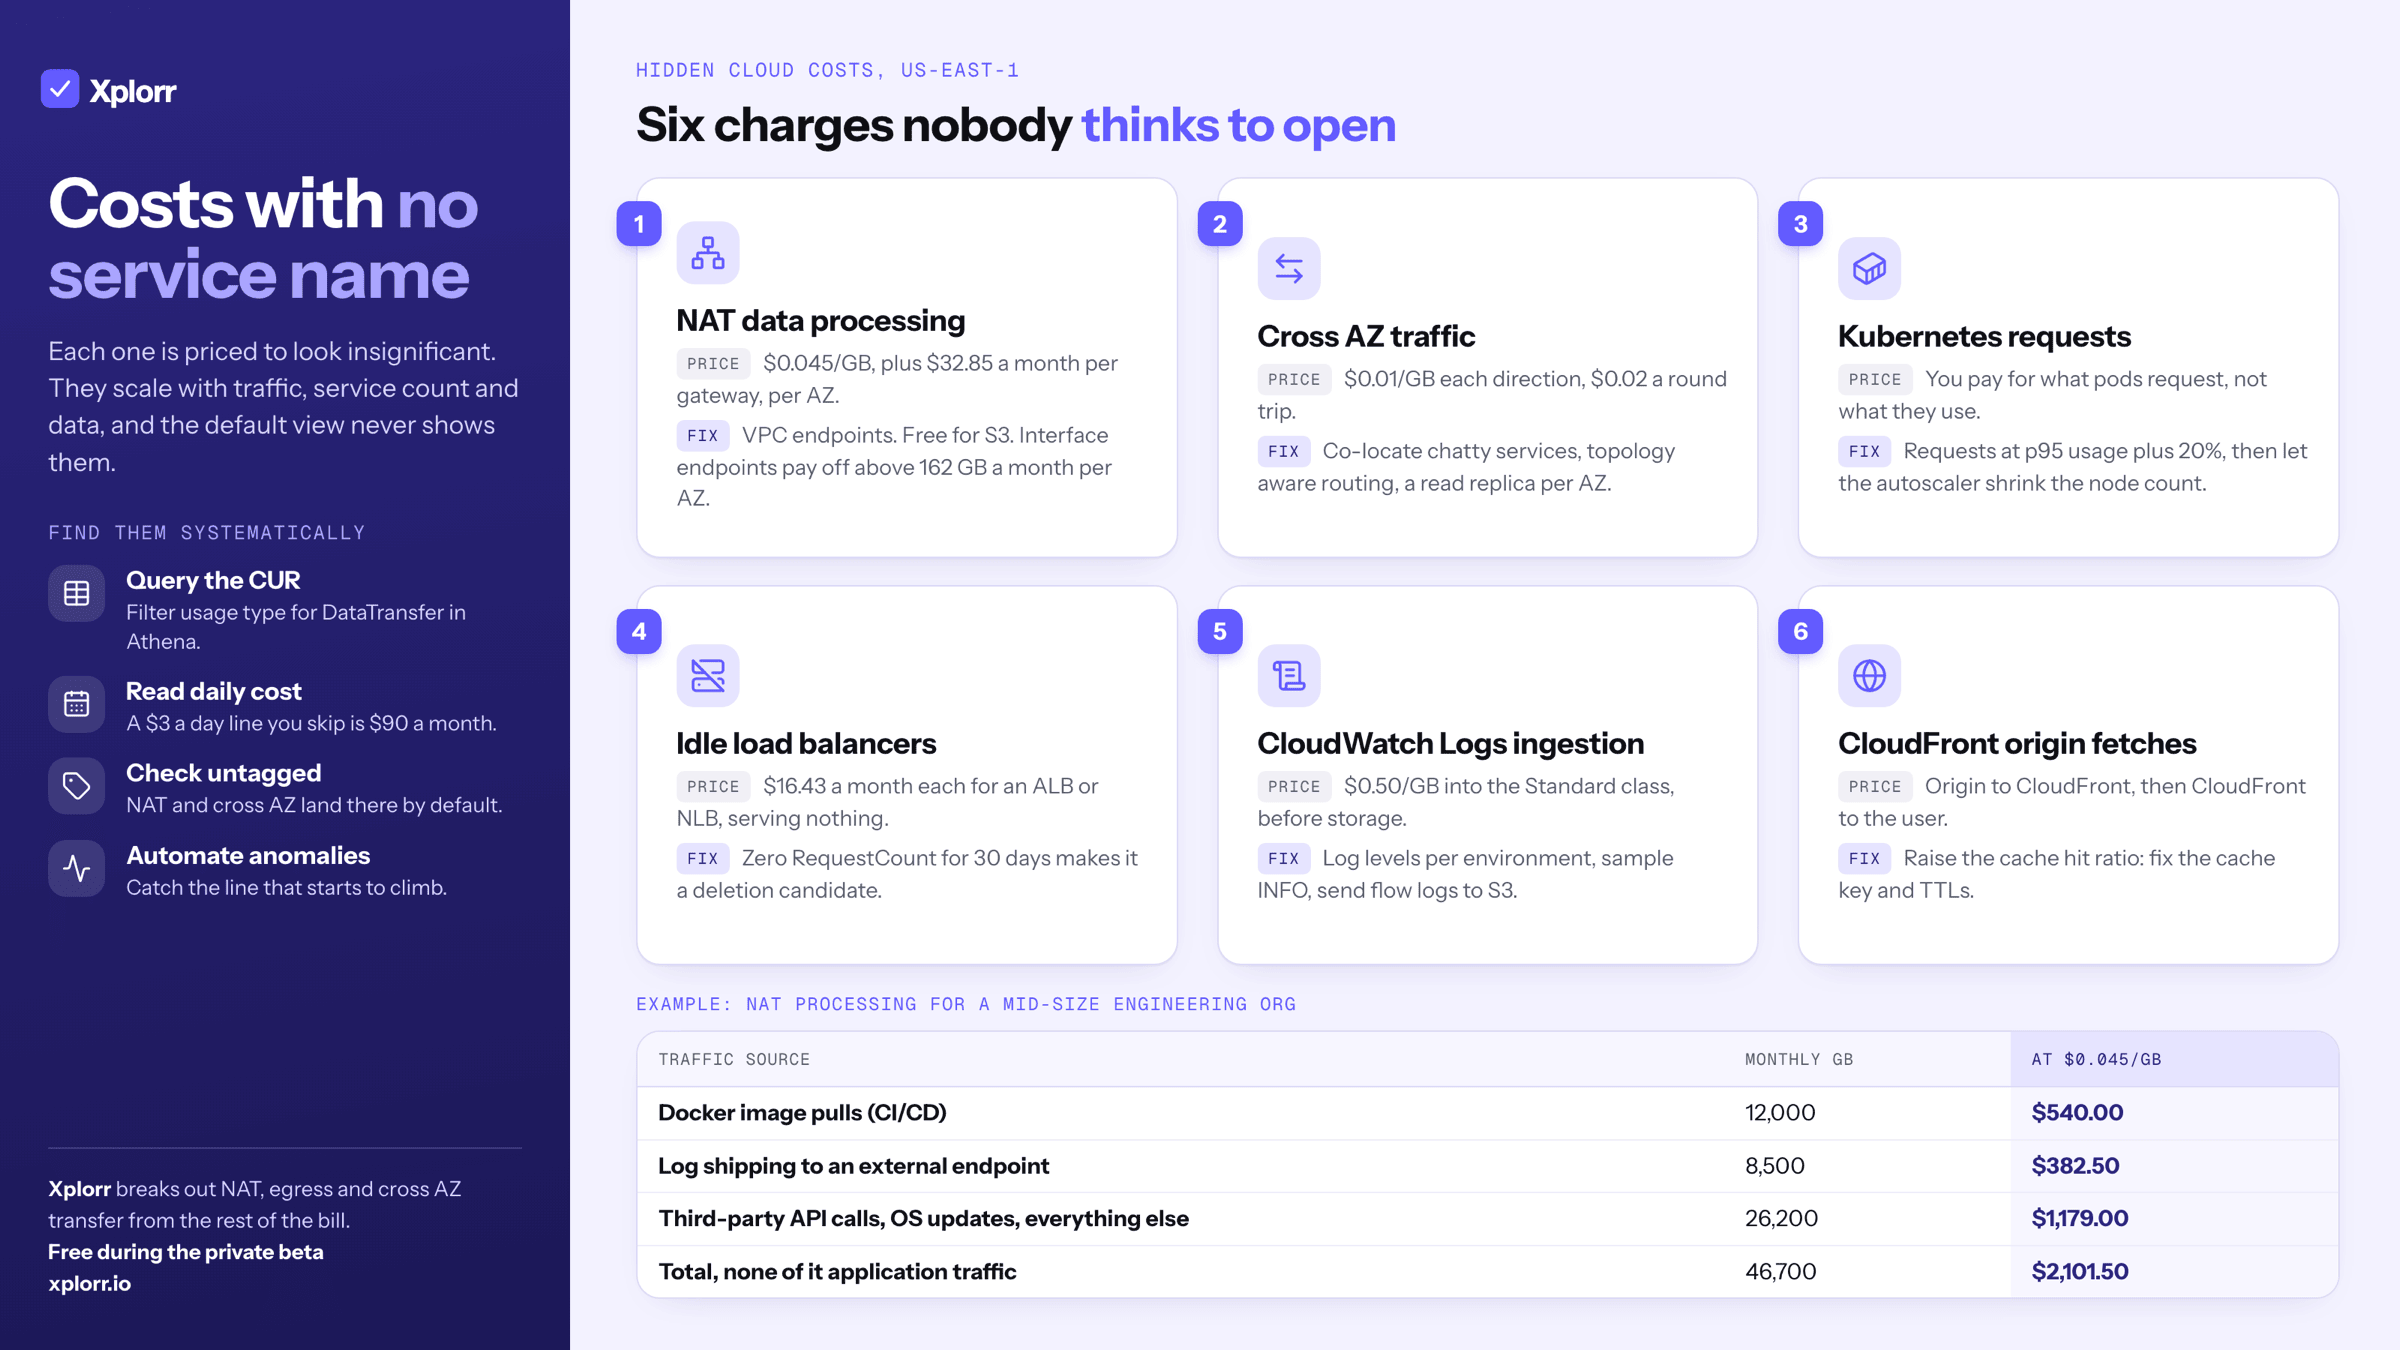
The cloud costs teams miss are the ones with no service name anyone thinks to open: NAT Gateway data processing at $0.045/GB, cross-AZ transfer at $0.01/GB each way, idle load balancers at $16.43/month each, CloudWatch log ingestion at $0.50/GB, and Kubernetes nodes paid for by resource request rather than by use.
Every one of them is priced below, in us-east-1, so you can count your own.
To see which of them are on your own bill, export Cost Explorer grouped by usage type and drop the CSV into the free AWS waste finder. It ranks these charges by cost and runs entirely in your browser, so the file is never uploaded.
What Does Cross-AZ Traffic Cost?
Every time a service in us-east-1a talks to a database in us-east-1b, AWS charges $0.01/GB in each direction. That is $0.02/GB for a round trip.
Prices checked September 2026, us-east-1.
Trivial until you do the arithmetic. Ten microservices making frequent cross-AZ calls can push 50 to 100 TB a month of inter-AZ traffic. At $0.02/GB round trip that is $1,000 to $2,000 a month purely for your own services to talk to each other inside one region.
How to find it: in Cost Explorer, filter by Usage Type and look for entries containing DataTransfer-Regional-Bytes. The number is almost always higher than people expect, because nothing in the default billing view names it.
How to fix it: co-locate latency-sensitive services in one AZ where your availability requirements allow it, use topology-aware routing in Kubernetes so pods prefer same-AZ endpoints, and for read-heavy workloads put a read replica in each AZ instead of crossing a boundary on every query.
Why Does CloudFront Charge You Twice?
When CloudFront fetches from your origin, whether that is an ALB or an S3 bucket, you pay for transfer from the origin to CloudFront and then for CloudFront’s transfer to the end user. For frequently invalidated content or a low cache hit ratio, the double charge compounds.
The lever is the cache hit ratio, and it is close to linear. At a 40% hit ratio, 60% of requests reach your origin, so you pay origin-side costs on six times the volume you would at a 90% hit ratio.
Check CacheHitRate in the CloudFront console per distribution. A low number usually means one of two things: a cache key that carries a header or query string varying per request, or a TTL short enough that nothing stays cached. Both are configuration, not architecture, so both are cheap to fix.
When Does VPC Peering Start Costing Money?
A common misreading: VPC peering is not free inside a region. Traffic over a peering connection that stays within one Availability Zone is free. Traffic that crosses AZs is billed at $0.01/GB in each direction, and cross-region peering is billed at the inter-region rate of $0.02/GB.
Prices checked September 2026, us-east-1.
The pattern to look for is a scheduled job that crosses a region boundary. An analytics pipeline pulling production data from us-east-1 to a processing cluster in eu-west-1 every hour moves the same dataset 730 times a month and pays $0.02/GB each time.
The fix is to move the data once rather than repeatedly. Replicate into an S3 bucket in the destination region and have the pipeline read locally. You then pay transfer on changed objects instead of on the full dataset every hour.
Why Is NAT Gateway So Expensive?
If one AWS cost surprises more teams than any other, it is NAT Gateway. It sits in the top five line items for most organizations running workloads in private subnets, and almost nobody budgets for it.
| Charge | List price | Monthly |
|---|---|---|
| NAT Gateway hourly | $0.045/hr | $32.85 per gateway |
| NAT Gateway data processing | $0.045/GB | varies with traffic |
Prices checked September 2026, us-east-1.
The processing charge is the one that hurts. Every byte leaving a private subnet for the internet passes through the gateway and is billed at $0.045/GB: Docker image pulls, OS package updates, API calls to third-party services, logs shipped to an external endpoint, all of it.
The hourly charge multiplies by AZ, since a resilient setup runs one gateway per AZ.
What Does NAT Data Processing Add Up To?
Nothing here is exotic. A mid-size engineering org running CI in private subnets generates traffic like this:
| Traffic source | Monthly GB | At $0.045/GB |
|---|---|---|
| Docker image pulls (CI/CD) | 12,000 GB | $540.00 |
| Log shipping to an external endpoint | 8,500 GB | $382.50 |
| Third-party API calls | 6,200 GB | $279.00 |
| OS package updates | 4,800 GB | $216.00 |
| Everything else | 15,200 GB | $684.00 |
| Total | 46,700 GB | $2,101.50 |
Prices checked September 2026, us-east-1. Add $32.85/month per gateway for the hourly charge, times the number of AZs.
Not one line of that is application traffic, and none of it appears under a service name anyone would think to investigate. It shows up as “EC2 - Other” or as a NAT Gateway line that looks like infrastructure overhead rather than a variable cost.
How Do You Cut NAT Gateway Costs?
VPC endpoints for AWS services. The single highest-impact fix. Traffic from private subnets to S3, DynamoDB, CloudWatch or ECR does not need to leave through the NAT Gateway at all.
An S3 gateway endpoint is free and routes S3 traffic over the AWS backbone. If you pull large datasets from S3 in private subnets, that alone can save hundreds a month.
Interface endpoints cost $0.01/hr, or $7.30/month per AZ, and remove the $0.045/GB NAT charge for that traffic. The break-even is 7.30 / 0.045, so about 162 GB per month per AZ. Most CI pipelines clear that in a day. To measure NAT processing before and after the change, Xplorr’s network costs view breaks out NAT, egress and cross AZ transfer from the rest of the bill.
Prices checked September 2026, us-east-1.
Cache Docker images locally. An ECR pull-through cache, or a registry mirror, turns N identical layer pulls into one. The saving scales with how often CI refetches the same base image, which for most pipelines is every job.
Move log shipping onto an endpoint. CloudWatch Logs has an interface endpoint, and the same 162 GB per AZ break-even applies.
Why Are Kubernetes Clusters Over-Provisioned?
A developer writes a deployment manifest and sets resource requests to “something safe”, maybe 500m CPU and 512Mi memory. The pod actually uses 80m CPU and 120Mi at steady state. The scheduler reserves the full requested amount on the node regardless.
Multiply across 200 pods and the cluster is close to fully allocated while barely being used. Allocation is what you pay for. Utilization is what you get.
Three things keep it that way:
Defaults ship high. Most Helm charts and example manifests carry generous defaults. The nginx-ingress chart defaults to 100m CPU and 90Mi memory per replica, well above actual usage on a low-traffic cluster.
Nobody revisits. The request was set on the first deployment, before anyone knew the resource profile. Six months later there is plenty of metrics data and the manifest is unchanged.
Requests get set equal to limits. The scheduler then reserves the absolute peak a pod could ever reach, on every node, permanently.
What Does Over-Provisioned Kubernetes Cost?
Take a cluster of 10 m5.2xlarge nodes at the $0.384/hr on-demand list price:
10 nodes x $0.384/hr x 730 hrs = $2,803.20/month
per-node cost                   =   $280.32/month
Prices checked September 2026, us-east-1, Linux, on-demand.
Suppose measured CPU usage across the cluster runs at 30% of what is requested. Right-sized to measured usage plus headroom, the same pods fit on 4 to 5 nodes. That removes 5 to 6 nodes, or $1,401.60 to $1,681.92 a month on one cluster.
Most organizations run three to five clusters (prod, staging, dev, sometimes per region). The same gap exists in each, and the non-production ones are usually worse because nobody measured them at all.
How Do You Right-Size Pod Requests?
Step 1: install something that shows the gap between requested and actual. Metrics Server plus Grafana and Prometheus, or your APM tool’s Kubernetes view, will give you usage against requests per pod. Xplorr’s Kubernetes view shows the same gap per workload from OpenCost data.
Step 2: set requests to the p95 of actual usage plus roughly 20% headroom. Not the peak, the p95. A pod at 80m CPU p95 with requests at 500m should drop to 100m.
Step 3: enable Cluster Autoscaler or Karpenter. Once requests reflect reality, the autoscaler makes correct node-count decisions. Over-requested pods make it provision nodes nothing needs.
Step 4: split node pools by workload profile. Memory-heavy pods on r-series, compute-heavy on c-series. Running everything on general-purpose m-series means over-provisioning one dimension to satisfy the other.
What Do Idle Load Balancers Cost?
| Load balancer type | List price | Monthly, before any LCU |
|---|---|---|
| Application Load Balancer | $0.0225/hr | $16.43 |
| Network Load Balancer | $0.0225/hr | $16.43 |
| Classic Load Balancer | $0.025/hr | $18.25 |
Prices checked September 2026, us-east-1.
Three idle ALBs is $49.29 a month. Eight is $131.44. For resources serving zero requests.
They accumulate the same few ways: a service was decommissioned but the infrastructure was not fully torn down, a blue/green deployment left the old one in place, a test environment was half cleaned up, or someone created one manually to test something and moved on.
How to find them: in Cost Explorer, filter to ELB and look for load balancers with near-zero LCU charges alongside a full hourly charge. Or check the CloudWatch RequestCount metric. Zero requests over 30 days makes it a deletion candidate.
What Does CloudWatch Log Ingestion Cost?
CloudWatch Logs charges $0.50/GB to ingest into the Standard log class, or $0.25/GB into Infrequent Access. That is the cost to write the log, before storage or any query.
Prices checked September 2026, us-east-1.
One verbose service logging request and response bodies at INFO can produce 50 to 100 GB a month, so $25 to $50 for that service alone. Across 20 services you are at $500 to $1,000 a month to write logs that in many cases nobody reads.
The usual offenders are debug logging left on in production, full request and response body capture, Kubernetes control plane logging with every log type enabled, and VPC Flow Logs or CloudTrail data events turned on broadly with no filter.
Fixes: set log levels per environment, sample verbose logs rather than capturing everything (10% at INFO, 100% at ERROR), filter at the application rather than after ingestion, and for VPC Flow Logs use a custom format with only the fields you need and send them to S3, where storage is $0.023/GB-month instead.
What Does Secrets Manager Cost Per Secret?
AWS Secrets Manager charges $0.40 per secret per month plus $0.05 per 10,000 API calls.
Prices checked September 2026, us-east-1.
Negligible at small scale. The failure mode is storing every config value as its own secret. 340 secrets is $136 a month. If 250 of those are non-sensitive configuration that belongs in SSM Parameter Store, which is free for standard parameters, then $100 a month is buying nothing but the habit of reaching for the same tool twice.
Small in absolute terms, and representative of the wider pattern: per-unit pricing that looks cheap individually and accumulates while nobody is watching.
How Do You Find Hidden Costs Systematically?
Hunting these one at a time is tedious. Four routines cover most of it.
Query the Cost and Usage Report. The CUR is a line-item dump of your entire bill. Export it to S3 and query with Athena. Group by product_product_name sorted by cost to surface unexpected services, filter usage_type for DataTransfer to see every transfer charge in one view, and look for line_item_type = "Usage" where the service is not on your known-infrastructure list.
Read the daily unblended cost view. Switch Cost Explorer to daily granularity and scan for steady charges you do not recognize. A $3/day line is easy to skip past and costs $90 a month.
Run tag-based gap analysis. Untagged cost is either a forgotten resource or a charge you did not know existed, and NAT processing and cross-AZ transfer land there by default because neither attaches to a taggable resource.
Automate anomaly detection. Manual review catches known problems. Automated detection catches the rest: a transfer spike, a new service appearing, a flat line item that starts climbing. Xplorr runs this across AWS, Azure and GCP, so the alert arrives instead of the CUR query being something you meant to get to.
Why Do These Costs Stay Hidden?
Cloud providers price data transfer, NAT Gateways and managed service API calls so that every individual charge looks insignificant. $0.045/GB here, $0.01/GB there, $0.40 per secret. Nobody would look twice at any one of them.
But they are multiplicative. They scale with traffic, with service count, with data volume, and none of them is prominently displayed in a default billing view. The default dashboard shows your top services by spend, which are precisely the ones you already know about.
That work (auditing transfer paths, checking NAT processing, reviewing Kubernetes utilization, hunting idle resources) belongs on a quarterly cadence at minimum, and monthly above roughly $50K/month of cloud spend.
The point is not that some fixed percentage of your bill is recoverable. It is that the recoverable part is, by construction, the part nobody is looking at. Work the categories above against your own account, price each finding at list, and the total is whatever it is. The only way to get that number wrong is not to go looking.
Keep reading
- AWS Cost Optimization Strategies That Actually Work
- 5 Signs Your Cloud Bill Is About to Spike
- What Is a Cloud Cost Anomaly (And Why You Should Care)
See how Xplorr helps → Features
Xplorr shows your AWS, Azure and GCP spend in one place, with anomaly detection, budgets and rightsizing recommendations. Get started free.
Written by
Xplorr team
The people who build Xplorr
Written together by the engineers who build Xplorr: the AWS, Azure, GCP and Kubernetes collectors, the console, and the alerting behind them.
About Xplorr