AWS Cost Optimization Strategies That Actually Work
A practical AWS cost optimization playbook with real CLI commands, CloudWatch queries and a step-by-step audit process you can run on your own accounts.

Xplorr team
The people who build Xplorr
In this post
- Where does AWS spend actually leak?
- What does one idle EC2 instance actually cost?
- How much do orphaned EBS volumes and snapshots cost?
- Why is my NAT Gateway bill so high?
- What does cross-AZ data transfer cost?
- What does CloudWatch Logs ingestion cost?
- How do you run an AWS cost audit?
- Which services cost the most?
- How do you find idle EC2 instances?
- How do you find orphaned EBS volumes?
- Which snapshots are safe to delete?
- How do you cut NAT Gateway traffic?
- How do you break out data transfer costs?
- What is each finding worth?
- Two multipliers on top of the table
- Which mistakes cost the most?
- Optimizing the wrong things
- Buying commitments too early
- Ignoring data transfer costs
- Downsizing when you shouldn’t
- What should the recurring process look like?
- What should you do first?
The AWS cost optimization strategies that actually work are unglamorous: terminate idle EC2 instances, delete orphaned EBS volumes and stale snapshots, move NAT Gateway traffic onto VPC endpoints, stop cross-AZ chatter, cap CloudWatch Logs ingestion, and switch non-production off outside working hours. Right-size before you buy any commitment. Each one is arithmetic over published list prices.
Waste in a mature AWS account is rarely concentrated in one place. It is spread across dozens of small, boring things that nobody has looked at in months, each individually too cheap to bother with and collectively the difference between a bill you can explain and one you cannot. What follows is an audit you can run against your own accounts, with the commands to run and the published list prices to multiply them by.
Where does AWS spend actually leak?
Five line items account for most of the waste in accounts that have never been audited. None of them is the thing people expect, which is an oversized production database. They are all things that accumulate quietly because no single instance of them is expensive enough to notice.
What does one idle EC2 instance actually cost?
The scale surprises people because the arithmetic runs on instance-hours rather than instance count. Test boxes from two quarters ago, a Jenkins controller that GitHub Actions replaced, a couple of “temporary” bastion hosts.
At the $0.192/hr on-demand list price, a single forgotten m5.xlarge is 0.192 x 730 = $140.16/month. Fourteen of them, which is not an unusual number in an account that has been running for a few years, is $1,962.24/month for compute that serves nothing.
The tricky part isn’t finding them. It’s that nobody wants to turn them off because “someone might need that.” Create a spreadsheet. Tag the owners. Give them a week to respond. Then terminate. Xplorr’s recommendations flag running EC2 instances that averaged under 5% CPU over the last seven days, which makes a reasonable first list to send to owners.
How much do orphaned EBS volumes and snapshots cost?
EBS volumes persist after instance termination unless you explicitly configured DeleteOnTermination. Most people don’t. The result: a graveyard of available state volumes attached to nothing, billing at exactly the same rate as attached ones.
Snapshots are the real sleeper. Every automated backup, every AMI you created for a deploy pipeline, every “just in case” snapshot accumulates silently, and none of them show up as a line item anyone recognizes. EBS snapshots bill at $0.05/GB-month, so 4 TB of snapshots older than your retention policy is 4,096 x 0.05 = $204.80/month for data nobody knows exists.
Why is my NAT Gateway bill so high?
This one catches even experienced engineers. A NAT Gateway costs $0.045/hour just to exist, or $32.85/month at 730 hours. But the real cost is $0.045 per GB of data processed through it.
If your private subnet instances are pulling container images, downloading packages, or hitting external APIs, that traffic goes through NAT. A single gateway pushing 800 GB/month is $32.85 for the gateway plus 800 x 0.045 = $36.00 in processing fees, so $68.85/month.
Multiply that across three availability zones (a common HA pattern) and you’re at $206.55/month for plumbing, before anything useful happens.
What does cross-AZ data transfer cost?
AWS charges $0.01/GB for regional data transfer in, out or between availability zones. That sounds tiny until you realize your microservices are chatting across AZs thousands of times per second.
A service doing 50 MB/s of cross-AZ traffic moves about 4,320 GB a day, or roughly 129,600 GB a month: $1,296/month in data transfer alone. The classic case is a Kafka cluster with producers and consumers spread across three AZs and no topology awareness, where every message crosses an AZ boundary for no reason anyone chose.
What does CloudWatch Logs ingestion cost?
CloudWatch Logs charges $0.50/GB for standard-class ingestion on the first 10 TB each month. If you’re logging at DEBUG level in production (we’ve all done it), or if your application logs full request and response bodies, the bill grows fast.
A single chatty service ingesting 180 GB/month of logs is 180 x 0.50 = $90/month in ingestion alone, and if retention is set to “Never expire” the stored volume grows every month on top of that. Dropping the log level to INFO reduces the ingestion term, and a 30-day retention caps the storage term instead of letting it compound.
How do you run an AWS cost audit?
Here’s the exact sequence we run. It takes about a day per account for the first pass, and the steps are ordered so that each one narrows what the next one has to look at.
Which services cost the most?
Before touching anything, understand where the money goes. Pull a 3-month breakdown by service:
aws ce get-cost-and-usage \
  --time-period Start=2026-01-01,End=2026-03-18 \
  --granularity MONTHLY \
  --metrics "UnblendedCost" \
  --group-by Type=DIMENSION,Key=SERVICE \
  --output table
This gives you a ranked list. In most accounts, EC2, RDS, and S3 will be your top three. Don’t waste time optimizing a $12/month service when EC2 is costing you $18K.
How do you find idle EC2 instances?
Pull CPU utilization for all running instances over the last 14 days:
# List all running instances with their types and launch times
aws ec2 describe-instances \
  --filters "Name=instance-state-name,Values=running" \
  --query 'Reservations[].Instances[].{
    ID:InstanceId,
    Type:InstanceType,
    LaunchTime:LaunchTime,
    Name:Tags[?Key==`Name`]|[0].Value
  }' \
  --output table
Then for each instance, check CloudWatch:
aws cloudwatch get-metric-statistics \
  --namespace AWS/EC2 \
  --metric-name CPUUtilization \
  --dimensions Name=InstanceId,Value=i-0abc123def456 \
  --start-time 2026-03-04T00:00:00Z \
  --end-time 2026-03-18T00:00:00Z \
  --period 86400 \
  --statistics Average Maximum \
  --output table
Decision criteria:
| Avg CPU (14d) | Max CPU (14d) | Action |
|---|---|---|
| < 5% | < 10% | Almost certainly idle. Investigate and terminate. |
| < 15% | < 30% | Right-sizing candidate. Drop one or two instance sizes. |
| 15–40% | < 60% | Probably well-sized, but check memory and network too. |
| > 40% | > 70% | Leave it alone. This instance is doing real work. |
Don’t just look at CPU. An instance might have low CPU but high memory usage (common with Redis, Elasticsearch, or Java apps with large heaps). Check memory via CloudWatch agent metrics or SSH in and run free -h.
How do you find orphaned EBS volumes?
# Find all unattached EBS volumes with their size and creation date
aws ec2 describe-volumes \
  --filters "Name=status,Values=available" \
  --query 'Volumes[].{
    ID:VolumeId,
    Size:Size,
    Type:VolumeType,
    Created:CreateTime
  }' \
  --output table
For gp3 volumes, you’re paying $0.08/GB-month. A forgotten 500 GB volume is $40/month.
Before deleting: snapshot anything you’re unsure about. A snapshot of a 500 GB volume with 50 GB of actual data costs about $2.50/month, much cheaper than the volume itself.
# Snapshot before deleting
aws ec2 create-snapshot \
  --volume-id vol-0abc123 \
  --description "Backup before cleanup - March 2026" \
  --tag-specifications 'ResourceType=snapshot,Tags=[{Key=cleanup,Value=safe-to-delete-after-30d}]'

# Then delete the volume
aws ec2 delete-volume --volume-id vol-0abc123
Which snapshots are safe to delete?
Start by listing everything past your retention window:
# Find snapshots older than 180 days
aws ec2 describe-snapshots \
  --owner-ids self \
  --query 'Snapshots[?StartTime<`2025-09-18`].{
    ID:SnapshotId,
    Size:VolumeSize,
    Created:StartTime,
    Description:Description
  }' \
  --output table
Then cross-reference with your AMI list, so you’re not deleting a snapshot that backs a live AMI:
# Get all snapshot IDs referenced by AMIs
aws ec2 describe-images --owners self \
  --query 'Images[].BlockDeviceMappings[].Ebs.SnapshotId' \
  --output text
Any snapshot not in that list and older than your retention policy is a delete candidate.
How do you cut NAT Gateway traffic?
# Check NAT Gateway data processing over the last 30 days
aws cloudwatch get-metric-statistics \
  --namespace AWS/NATGateway \
  --metric-name BytesOutToDestination \
  --dimensions Name=NatGatewayId,Value=nat-0abc123 \
  --start-time 2026-02-18T00:00:00Z \
  --end-time 2026-03-18T00:00:00Z \
  --period 2592000 \
  --statistics Sum \
  --output json
If you’re seeing high NAT traffic from container image pulls, an Interface VPC endpoint for ECR at $0.01/hr, or $7.30/month per AZ, beats routing through NAT. For S3 access, a Gateway VPC Endpoint is free and eliminates NAT charges for S3 traffic entirely.
Quick NAT cost reduction checklist:
- Add a Gateway VPC Endpoint for S3 (free, immediate savings)
- Add a Gateway VPC Endpoint for DynamoDB if applicable (also free)
- Add Interface VPC Endpoints for ECR, CloudWatch, and SSM if traffic justifies $7.30/month/AZ each
- Check if any public-facing services are unnecessarily in private subnets routing through NAT
- Consider NAT instances for dev/staging environments where HA isn’t critical (a
t4g.nanoat $0.0042/hr is $3.07/month against $32.85/month for a NAT Gateway, before processing fees)
How do you break out data transfer costs?
Data transfer costs hide inside your EC2 line item. To pull them out:
aws ce get-cost-and-usage \
  --time-period Start=2026-02-01,End=2026-03-01 \
  --granularity MONTHLY \
  --metrics "UnblendedCost" \
  --group-by Type=DIMENSION,Key=USAGE_TYPE \
  --filter '{
    "Dimensions": {
      "Key": "SERVICE",
      "Values": ["Amazon Elastic Compute Cloud - Compute"]
    }
  }' \
  --output table
Look for usage types containing DataTransfer, InterZone, or Regional. If cross-AZ transfer is significant, consider:
- Enabling topology-aware routing in Kubernetes (if applicable)
- Placing tightly coupled services in the same AZ with fallback to other AZs
- Using ElastiCache or DAX in the same AZ as the consuming service
What is each finding worth?
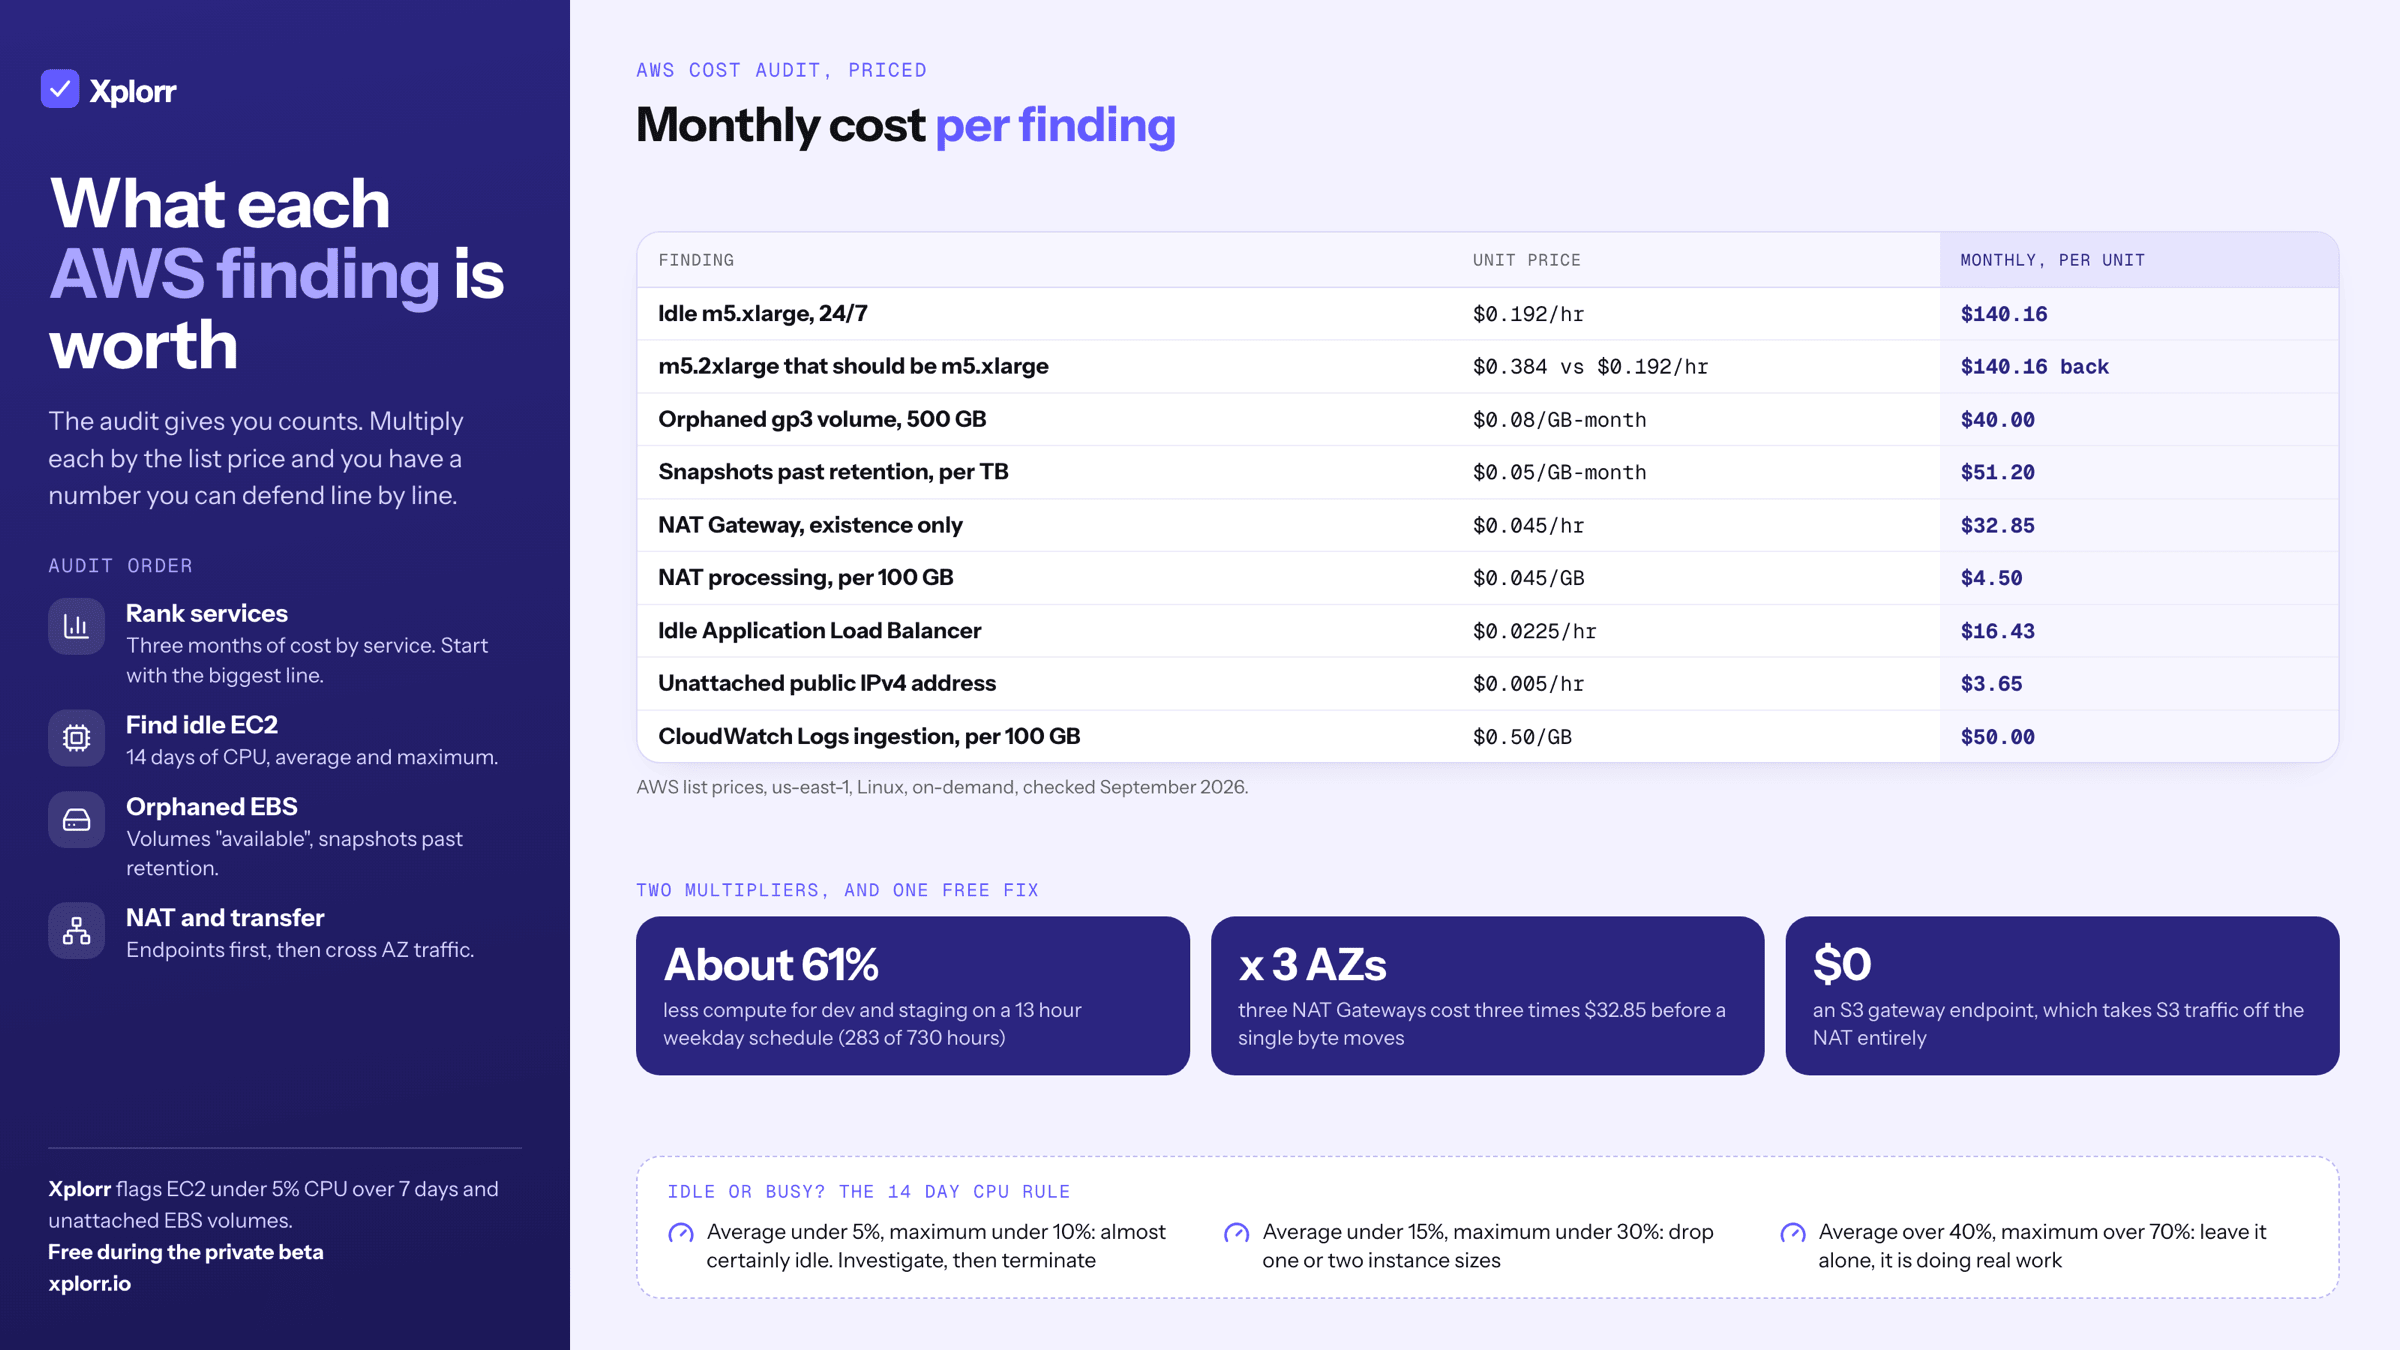
The audit gives you counts. To turn counts into a number you can take to a planning meeting, multiply each one by the relevant us-east-1 list price. Every figure below is published by AWS, so you can check it and so can whoever questions your estimate.
| Finding | Unit price | Monthly cost per unit |
|---|---|---|
Idle m5.xlarge, 24/7 |
$0.192/hr | $140.16 |
Over-sized m5.2xlarge that should be an m5.xlarge |
$0.384 vs $0.192/hr | $140.16 recovered |
| Orphaned gp3 volume, 500 GB | $0.08/GB-month | $40.00 |
| Snapshots past retention, per TB | $0.05/GB-month | $51.20 |
| NAT Gateway, existence only | $0.045/hr | $32.85 |
| NAT Gateway processing, per 100 GB | $0.045/GB | $4.50 |
| Idle Application Load Balancer | $0.0225/hr | $16.43 |
| Unattached public IPv4 address | $0.005/hr | $3.65 |
| CloudWatch Logs ingestion, per 100 GB | $0.50/GB | $50.00 |
Prices checked September 2026, us-east-1. Linux, shared tenancy, on-demand.
Two multipliers on top of the table
Scheduling. Anything in dev or staging that can be switched off outside working hours only runs about 283 of the 730 hours in a month on a 13-hour weekday schedule, so its compute line drops by roughly 61%. A ec2:StopInstances and ec2:StartInstances pair on an EventBridge schedule is an afternoon of work and applies to every non-production instance at once, which is usually why it is the largest single item on the list.
Availability zones. Most of the network line items multiply by the number of AZs you run. Three NAT Gateways is three times $32.85 before a single byte moves, and the same pattern applies to Interface VPC endpoints, which bill per endpoint per AZ.
Which mistakes cost the most?
Optimizing the wrong things
If your bill is $30K/month and $22K of that is EC2, don’t spend a week optimizing your $180 S3 storage costs. Start with the biggest line item. Always.
Buying commitments too early
Don’t buy Reserved Instances or Savings Plans until you’ve finished right-sizing. If you commit to an m5.2xlarge for a year and then realize the workload only needs an m5.large, you’re locked into paying for the larger instance.
Right-size first. Stabilize for 2–4 weeks. Then commit.
Ignoring data transfer costs
Data transfer doesn’t show up as its own service in Cost Explorer by default. It’s buried inside other service line items. Engineers often optimize compute and storage while completely ignoring the $2K/month in cross-AZ and internet egress charges.
Downsizing when you shouldn’t
Not every idle-looking instance should be downsized. Some workloads are bursty: low CPU 95% of the time, then spike to 80% during batch processing or deploys. Check the maximum CPU over 14 days, not just the average.
Also, don’t downsize your production database during a cost-cutting sprint without load testing first. The savings from going db.r5.xlarge to db.r5.large aren’t worth a P1 incident when your next traffic spike hits.
What should the recurring process look like?
A one-time audit saves money. A recurring process keeps it saved. Here’s what we recommend:
- Weekly: review Cost Explorer for any service with >10% week-over-week increase
- Monthly: run the orphaned resources check (EBS volumes, snapshots, EIPs, idle LBs)
- Monthly: review CloudWatch dashboards for under-utilized instances
- Quarterly: re-evaluate Reserved Instance and Savings Plan coverage
- On every architecture change: estimate data transfer costs before deploying
Set up AWS Budgets with alerts at 80% and 100% of your expected monthly spend. It takes five minutes, it is free, and it is the only item on this list that warns you while a problem is still cheap.
What should you do first?
Run the Cost Explorer breakdown, then the idle instance query. Those two commands take under an hour between them and tell you whether the rest of the audit is worth a day. Everything after that is working down the ranked list the first command produced.
The first audit has the biggest wins, because it is the only one that gets to clean up everything that accumulated before anyone was looking. Price your findings against the table above, and whatever number comes out is a number you can defend line by line.
If you want to automate the ongoing monitoring piece (catching cost anomalies, tracking idle resources, and getting alerts before waste accumulates), that’s exactly what Xplorr does. But the audit process above works with nothing but the AWS CLI and an afternoon.
Keep reading
- Hidden Cloud Costs You’re Probably Missing Right Now
- AWS Reserved Instances vs Savings Plans: A Decision Framework
- How to Cut Your AWS Bill in One Week: A Practical Checklist
See how Xplorr helps → Features
Xplorr shows your AWS, Azure and GCP spend in one place, with anomaly detection, budgets and rightsizing recommendations. Get started free.
Written by
Xplorr team
The people who build Xplorr
Written together by the engineers who build Xplorr: the AWS, Azure, GCP and Kubernetes collectors, the console, and the alerting behind them.
About Xplorr