Catch a cost spike in days, not at invoice time
Threshold alerts fail for the same reason every time: nobody maintains a threshold for hundreds of service and account combinations, and a number that is normal for EC2 is absurd for Route 53. Xplorr compares each service on each account against its own recent baseline, so the comparison stays meaningful without anyone configuring it.
Inputs
Where the Anomaly Detection numbers come from
Xplorr reads your accounts with read only credentials and never writes to your infrastructure. These are the sources behind this screen.
- Daily cost by service and account
- The same daily cost data Xplorr syncs from AWS Cost Explorer, Azure Cost Management and the GCP billing export. Detection runs on billed cost, so an alert always corresponds to money.
- Each series own history
- The baseline for a service is built from that service recent spend on that account, which is what makes the comparison fair across services of very different sizes.
- Region and account metadata
- Carried through to the alert so the first question after a spike, where is this happening, is already answered.
Method
How the Anomaly Detection numbers are worked out
No black box. If a figure is an estimate or an apportionment rather than a billed line, the page says so.
A baseline is built per service, per account
Spend is compared against a rolling average of that same series rather than a global threshold. A service that always costs $12 a day and a service that always costs $1,200 a day are each judged against themselves.
Deviation is measured against that baseline
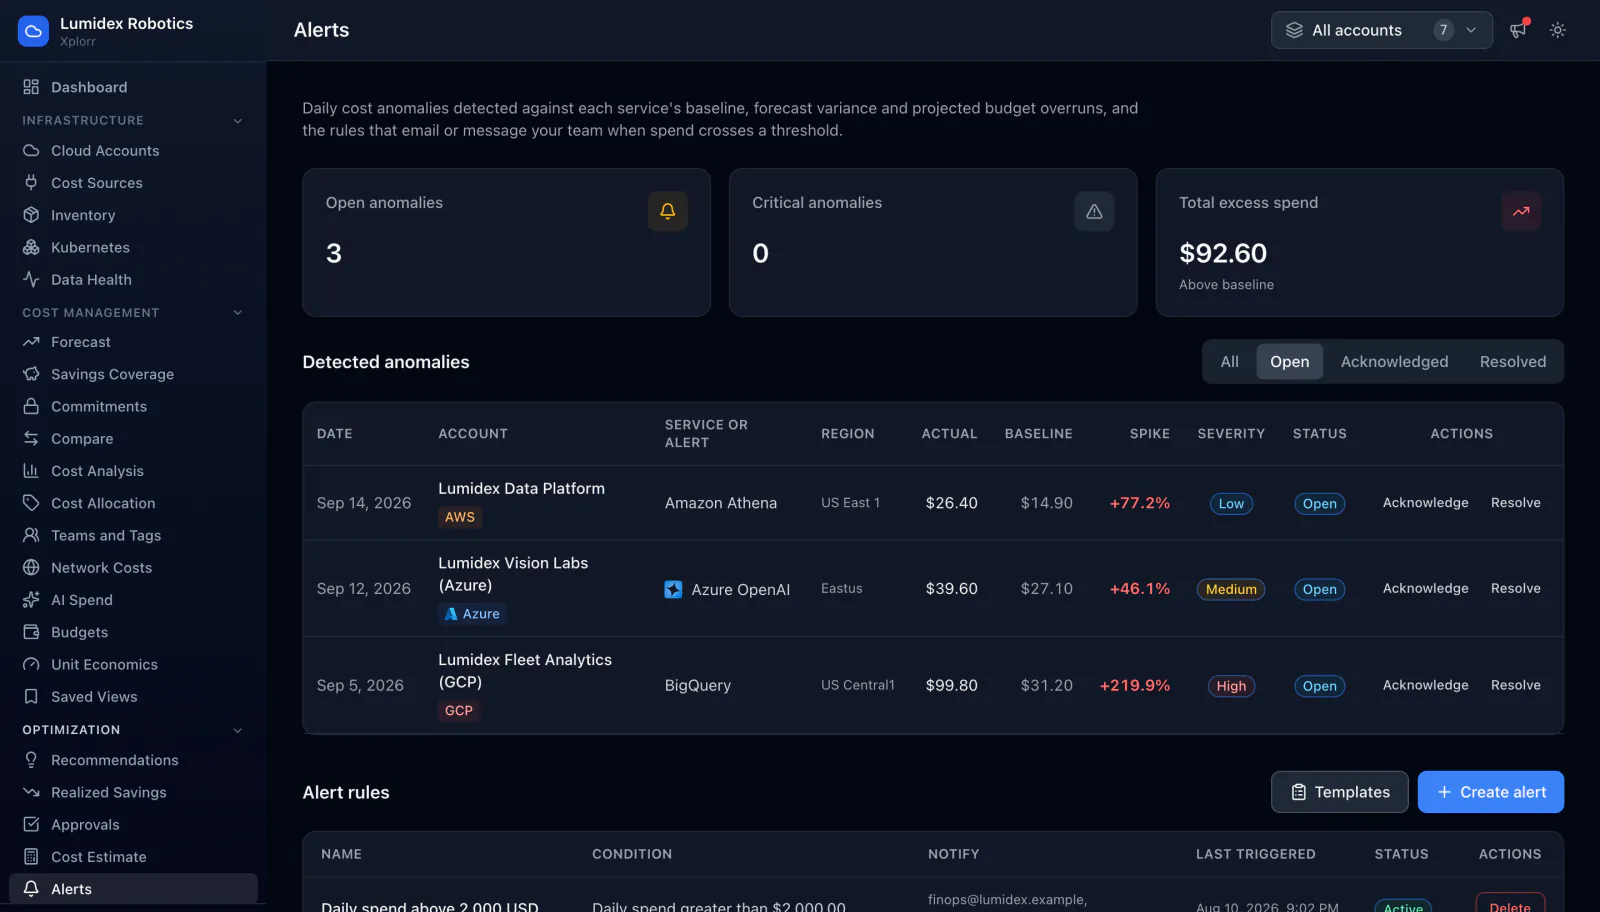
An anomaly records the actual cost and the baseline cost together, along with the size of the spike, so the alert carries its own evidence instead of just asserting that something is wrong.
Severity scales with the size of the deviation
Anomalies are graded so that a small wobble and a tenfold jump do not arrive looking identical, and a count of critical ones is shown separately from the total.
Excess spend above baseline is totalled
Every open anomaly contributes the amount by which it exceeded its baseline, which turns a list of alerts into one number describing what the spikes are currently costing.
Anomalies have a lifecycle
Each one can be acknowledged or resolved, so a known and accepted spike stops being reported as an open problem and the list stays worth reading.
In the console
What is on the Anomaly Detection screen
- Count of open anomalies and how many are critical
- Total excess spend above baseline across everything currently open
- A table of anomalies with account, service and region
- Actual cost against baseline cost, with the spike size as a percentage
- Severity and status per anomaly, with acknowledge and resolve actions
- Configurable alert rules underneath the detected anomalies
Common questions about Anomaly Detection
Do I have to configure thresholds?
How quickly does an anomaly appear?
Will a planned launch trigger alerts?
Background reading
For what counts as an anomaly and why fixed thresholds miss most of them, read What is a cloud cost anomaly.
If your spend is mostly on AWS, AWS cost anomaly detection compares this with the free AWS Cost Anomaly Detection service.
Related features
How this compares
See this on your own accounts
Connect a cloud account with read only credentials and the first sync pulls your last 30 days, so this screen fills with your numbers instead of the demo workspace. Free during beta.