See what is covered, what is on demand, and what could still be
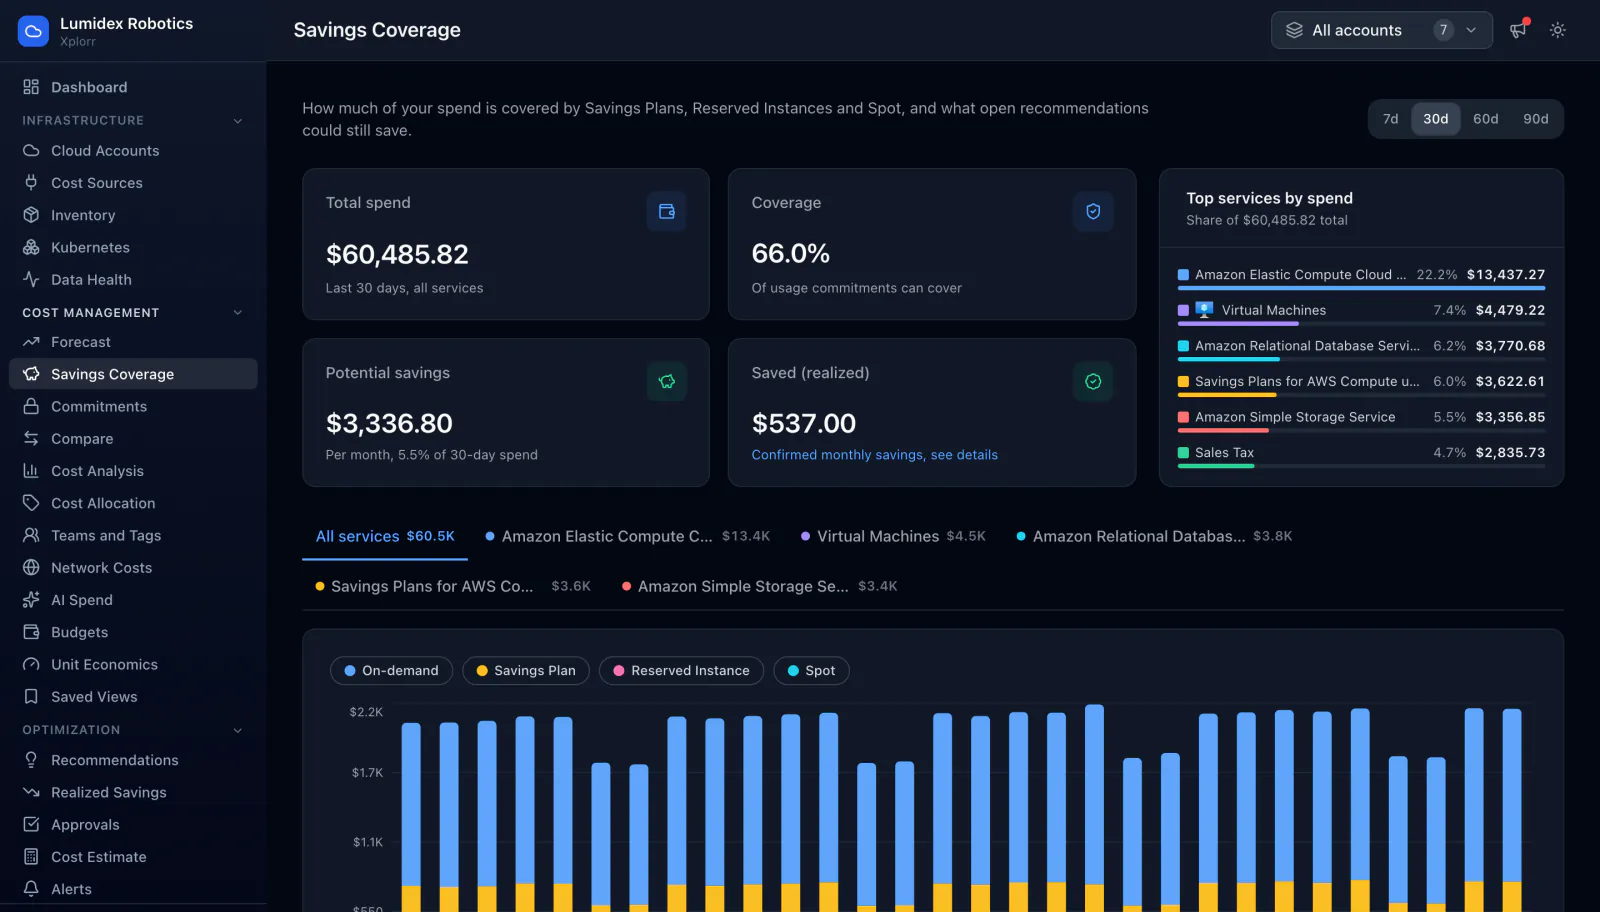
Coverage is the share of commitment eligible usage that a Savings Plan, Reserved Instance or Spot capacity actually covers. Xplorr splits every day of spend into those four buckets, ranks the services behind the total, and sets the coverage figure next to what open recommendations could still save and what has already been confirmed.
Inputs
Where the Savings Coverage numbers come from
Xplorr reads your accounts with read only credentials and never writes to your infrastructure. These are the sources behind this screen.
- Billing records with their purchase type
- Each usage line arrives from the provider already marked as on demand, covered by a Savings Plan, covered by a Reserved Instance or Spot. The split is read from the bill rather than inferred.
- Your active commitments
- The Savings Plans and Reserved Instances you hold supply what is available to cover usage in the first place, and the coverage reported here is drawn from the provider own coverage reporting rather than inferred from service names.
- Open recommendations
- The potential savings figure comes from the recommendations that are still open, so coverage is shown next to the work that has not been done yet rather than in isolation.
Method
How the Savings Coverage numbers are worked out
No black box. If a figure is an estimate or an apportionment rather than a billed line, the page says so.
Coverage is measured against eligible usage only
Commitments cover compute, not everything on the bill. Object storage, data transfer and tax cannot be covered by any Savings Plan, so coverage is reported against the usage commitments can actually cover. A percentage of total spend would look worse than reality and could never reach 100.
Every day is split four ways
Daily spend is stacked into on demand, Savings Plan, Reserved Instance and Spot. Seeing it per day rather than as one monthly average is what exposes a commitment that stopped covering partway through the month.
Spot is tracked as its own bucket
Spot is a discount you got without committing to anything, so folding it into commitment coverage would overstate how much of your usage is actually locked in. It is counted separately for that reason.
Potential savings is expressed as a share of spend
The outstanding opportunity is shown both in currency per month and as a percentage of the period spend, because a number on its own does not say whether it is worth a sprint.
Realized savings sits beside the projection
Confirmed savings, measured from before and after cost in your bills, is shown next to the potential figure and never added to it. One is measured and one is a forecast.
In the console
What is on the Savings Coverage screen
- Total spend for the selected window across all services
- Coverage as a percentage of the usage commitments can cover
- Potential monthly savings, and what share of period spend it represents
- Confirmed realized savings, linked through to the measurement behind it
- Top services by spend with each one share of the total
- A daily stacked chart of on demand, Savings Plan, Reserved Instance and Spot
- Per service tabs to narrow the chart, and windows of 7, 30, 60 or 90 days
Common questions about Savings Coverage
What is the difference between coverage and utilization?
Why is coverage not a percentage of my whole bill?
Why is Spot counted separately from Savings Plans?
Is 100 percent coverage the goal?
Background reading
Which commitment type raises coverage with the least risk is the subject of AWS Reserved Instances vs Savings Plans.
Related features
How this compares
See this on your own accounts
Connect a cloud account with read only credentials and the first sync pulls your last 30 days, so this screen fills with your numbers instead of the demo workspace. Free during beta.