Kubernetes Cost Optimization: Cutting Pod and Node Spend
A practical Kubernetes cost optimization guide: overprovisioning fixes, HPA vs VPA vs Cluster Autoscaler, spot instance pools and resource tuning with YAML.

Xplorr team
The people who build Xplorr
In this post
- Why do Kubernetes clusters cost more than they use?
- What does that gap cost in nodes?
- How do you measure actual pod usage?
- Which query shows the waste?
- How do you right-size resource requests?
- HPA vs VPA vs Cluster Autoscaler: which should you use?
- When should you use the Horizontal Pod Autoscaler?
- When should you use the Vertical Pod Autoscaler?
- How do you configure the Cluster Autoscaler for cost?
- Which workloads can run on Spot instances?
- How do you set up mixed node pools on EKS?
- How do you pin workloads to the right pool?
- Why do you need a Pod Disruption Budget?
- How much does scheduling dev clusters save?
- What does the whole change add up to?
- Which Kubernetes cost mistakes are most common?
- What should you do first?
Kubernetes cost is set by the CPU and memory requests in your YAML, not by traffic. The scheduler packs pods against requests, the cluster autoscaler buys nodes until every request fits, and you pay for nodes. So the highest-leverage change is measuring real usage and lowering requests to match, then autoscaling, then Spot, then switching non-production off overnight. In that order.
Requests are almost always written from fear rather than from measurement. This guide walks through each change, with the YAML to make it and the arithmetic to price it against published us-east-1 list rates.
Why do Kubernetes clusters cost more than they use?
A cluster’s bill tracks what pods request, not what they use. Actual consumption never enters the calculation.
Requests get set high for a completely rational reason: nobody wants to be the person whose pod got OOMKilled in production at 2 AM. So engineers set requests high, then set limits higher, and the autoscaler dutifully buys the hardware to back the request. The gap between requested and used is the bill you did not intend to pay. Xplorr’s Kubernetes view reads that gap per workload from OpenCost and suggests a lower request based on the observed peak.
Here’s what that looks like on a typical API service deployment:
# Before: the "better safe than sorry" configuration
resources:
  requests:
    cpu: "1000m"
    memory: "2Gi"
  limits:
    cpu: "2000m"
    memory: "4Gi"
Suppose kubectl top pods shows this container averaging 120m CPU and 340Mi memory. That is 12% CPU and 17% memory utilization against requests. The scheduler reserved a full core and 2 GiB for a pod using a fraction of it.
What does that gap cost in nodes?
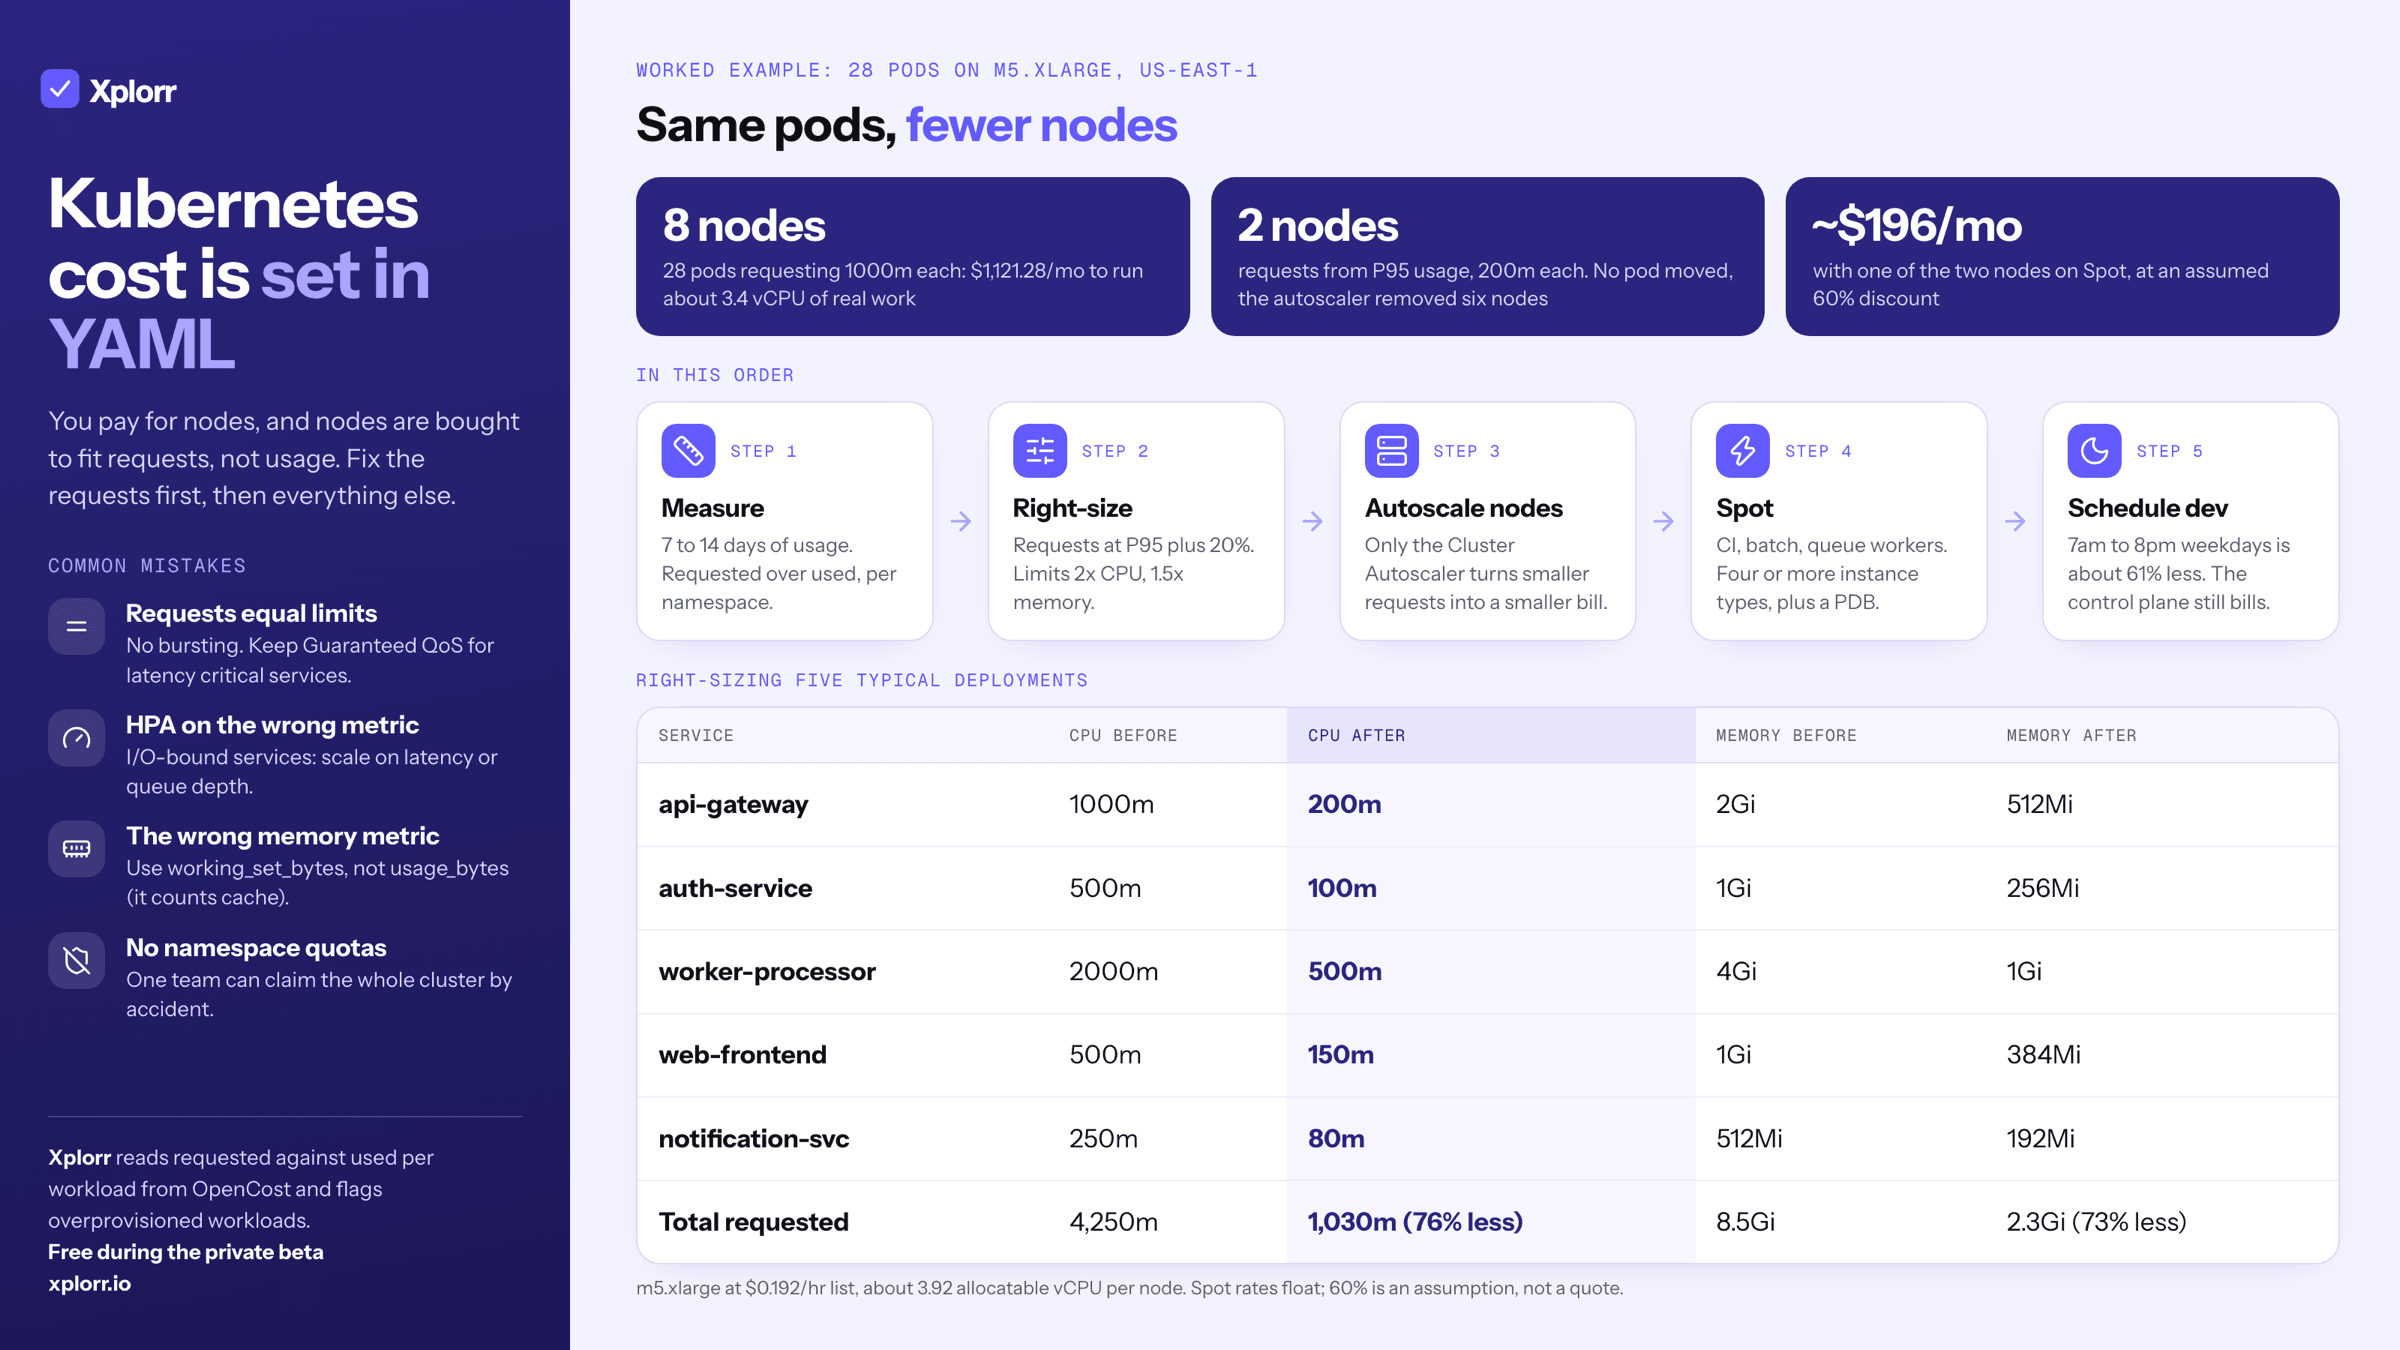
Multiply it out. Twenty-eight pods requesting 1000m each is 28 vCPU of requests. An m5.xlarge EKS node has 4 vCPU, of which roughly 3.92 are allocatable once the kubelet and system reservations are taken out, so the autoscaler needs 8 nodes to fit them.
At the $0.192/hr on-demand list price, that is 8 x 0.192 x 730 = $1,121.28/month to schedule pods that between them consume about 3.4 vCPU. The same 3.4 vCPU of real work fits comfortably on one node. Seven of the eight exist only because of numbers in YAML.
How do you measure actual pod usage?
You cannot optimize what you haven’t measured. Before touching any resource specs, collect at least 7 days of actual usage, ideally 14 to capture weekly traffic patterns. If you are choosing between a cluster only tool and one that also covers the cloud bill around it, Xplorr vs Kubecost sets the two side by side.
# Current resource requests vs actual usage
kubectl top pods -n production --containers

# Node-level utilization
kubectl top nodes
That gives you a snapshot. For historical data you need Prometheus.
| Metric | What it tells you |
|---|---|
container_cpu_usage_seconds_total |
Actual CPU consumed per container |
container_memory_working_set_bytes |
Real memory in use (not cache) |
kube_pod_container_resource_requests |
What the scheduler reserved |
kube_pod_container_resource_limits |
The ceiling before throttling or OOMKill |
node_cpu_seconds_total |
Node-level CPU consumption |
Which query shows the waste?
The ratio of requested CPU to consumed CPU is the single number worth watching:
# CPU request efficiency (higher = more waste)
sum(kube_pod_container_resource_requests{resource="cpu"}) by (namespace)
/
sum(rate(container_cpu_usage_seconds_total{container!=""}[5m])) by (namespace)
If this ratio is above 3, you’re paying for 3x the CPU you’re using. Run it per namespace rather than cluster-wide: the average hides which team’s manifests are driving the node count, and the fix is always a pull request against one team’s charts rather than a cluster-level setting.
How do you right-size resource requests?
This is where most of the savings come from. Not autoscaling, not Spot instances. Just setting requests to match measured usage with a reasonable buffer.
The formula: set requests to the P95 of actual usage plus a 20% buffer. Set limits to 2x requests for CPU, which allows bursting, and 1.5x for memory, which catches runaway leaks without being so tight that normal operation trips it.
Here’s the shape of the change across five deployments of the kind that dominate most clusters:
| Service | CPU request (before) | CPU request (after) | Memory request (before) | Memory request (after) |
|---|---|---|---|---|
| api-gateway | 1000m | 200m | 2Gi | 512Mi |
| auth-service | 500m | 100m | 1Gi | 256Mi |
| worker-processor | 2000m | 500m | 4Gi | 1Gi |
| web-frontend | 500m | 150m | 1Gi | 384Mi |
| notification-svc | 250m | 80m | 512Mi | 192Mi |
Those five go from 4,250m of CPU requests to 1,030m, a 76% reduction, and from 8.5Gi of memory requests to 2.3Gi, a 73% reduction. Nothing about the workloads changed. Only the numbers the scheduler reads did.
# After: based on actual measured usage
resources:
  requests:
    cpu: "200m"
    memory: "512Mi"
  limits:
    cpu: "400m"
    memory: "768Mi"
HPA vs VPA vs Cluster Autoscaler: which should you use?
They solve different problems and are not alternatives to each other. HPA changes how many pods you run. VPA changes how big each pod is. The Cluster Autoscaler changes how many nodes exist to hold them.
| Autoscaler | Changes | Use it for | Avoid when |
|---|---|---|---|
| HPA | Replica count | Stateless services that scale out | Single-instance or slow-starting workloads |
| VPA | Requests and limits | Workloads whose right size is hard to guess | You already run HPA on the same metric |
| Cluster Autoscaler | Node count | Turning freed requests into fewer nodes | Never, if you want the savings to land |
Only the Cluster Autoscaler actually removes cost. HPA and VPA change what you request; the Cluster Autoscaler is what converts a smaller request total into a smaller bill. Right-sizing without it just leaves half-empty nodes running.
When should you use the Horizontal Pod Autoscaler?
Use HPA when your workload handles more load by running more replicas: stateless web servers, API services, queue consumers. Avoid it for single-instance databases, stateful services that can’t scale horizontally, and anything that takes five minutes to start.
apiVersion: autoscaling/v2
kind: HorizontalPodAutoscaler
metadata:
  name: api-gateway-hpa
  namespace: production
spec:
  scaleTargetRef:
    apiVersion: apps/v1
    kind: Deployment
    name: api-gateway
  minReplicas: 2
  maxReplicas: 8
  behavior:
    scaleDown:
      stabilizationWindowSeconds: 300
      policies:
        - type: Percent
          value: 25
          periodSeconds: 60
    scaleUp:
      stabilizationWindowSeconds: 30
      policies:
        - type: Percent
          value: 50
          periodSeconds: 60
  metrics:
    - type: Resource
      resource:
        name: cpu
        target:
          type: Utilization
          averageUtilization: 70
    - type: Resource
      resource:
        name: memory
        target:
          type: Utilization
          averageUtilization: 75
Four decisions in that config carry the cost impact:
minReplicas: 2, not 1. You need at least 2 for availability during rolling deploys.scaleDown.stabilizationWindowSeconds: 300waits five minutes before scaling down, which prevents flapping during brief traffic dips.scaleUpis faster thanscaleDown. React quickly to load increases, be cautious about removing capacity.- Target utilization at 70%, not 50%. A 50% target means you permanently run double the pods you need.
When should you use the Vertical Pod Autoscaler?
Use VPA when the right resource request is hard to guess: batch jobs with variable needs, services with unpredictable memory profiles. Do not use it alongside HPA on the same metric, because VPA and HPA on CPU will fight each other.
apiVersion: autoscaling.k8s.io/v1
kind: VerticalPodAutoscaler
metadata:
  name: worker-processor-vpa
  namespace: production
spec:
  targetRef:
    apiVersion: apps/v1
    kind: Deployment
    name: worker-processor
  updatePolicy:
    updateMode: "Auto"
  resourcePolicy:
    containerPolicies:
      - containerName: worker
        minAllowed:
          cpu: "100m"
          memory: "128Mi"
        maxAllowed:
          cpu: "2000m"
          memory: "4Gi"
        controlledResources: ["cpu", "memory"]
VPA in Auto mode restarts pods to apply new resource values. In production, start with updateMode: "Off", which gives you recommendations without applying them. Review them, then switch to Auto once you trust them.
# Check VPA recommendations
kubectl describe vpa worker-processor-vpa -n production
How do you configure the Cluster Autoscaler for cost?
The Cluster Autoscaler adds or removes nodes based on pending pods. A pod can’t be scheduled, so a new node spins up. A node is underutilized, so it gets drained and removed. Every time you right-size requests or scale down replicas, it is what consolidates the workloads onto fewer nodes.
# cluster-autoscaler deployment args
- --scale-down-utilization-threshold=0.5
- --scale-down-delay-after-add=10m
- --scale-down-delay-after-delete=1m
- --scale-down-unneeded-time=5m
- --skip-nodes-with-local-storage=false
- --balance-similar-node-groups=truescale-down-utilization-threshold=0.5removes a node once it drops below 50% utilized. That is also the default and it is reasonable. Setting it aggressively (0.3) churns nodes constantly.scale-down-delay-after-add=10mstops a just-added node from being removed immediately, giving workloads time to stabilize.
Which workloads can run on Spot instances?
Spot instances (AWS), Spot VMs (Azure) and Spot VMs (GCP) run up to 90% below on-demand. The catch: the provider can reclaim them with two minutes notice.
Suits Spot:
- CI/CD runners
- Batch processing jobs
- Dev and staging environments
- Stateless workers behind a queue, where a dead pod means another picks up the message
- HPA-managed services with enough replicas that losing one or two pods is fine
Should stay on-demand:
- Databases and stateful services
- Services with only one or two replicas, where losing one means downtime
- Anything with a startup time over five minutes
How do you set up mixed node pools on EKS?
# managed node group with mixed instances
apiVersion: eksctl.io/v1alpha5
kind: ClusterConfig
metadata:
  name: production-cluster
  region: us-east-1

managedNodeGroups:
  - name: on-demand-critical
    instanceType: m5.large
    minSize: 2
    maxSize: 4
    labels:
      workload-type: critical
    taints:
      - key: dedicated
        value: critical
        effect: NoSchedule

  - name: spot-workers
    instanceTypes:
      - m5.large
      - m5a.large
      - m5d.large
      - m4.large
    spot: true
    minSize: 0
    maxSize: 10
    labels:
      workload-type: spot-tolerant
Diversifying instance types in the Spot pool is the part people skip. If you bid on one instance type and that pool gets reclaimed, all your Spot nodes go away at once. Four or more types from different families spreads that risk.
How do you pin workloads to the right pool?
Node affinity and tolerations control placement. Critical work gets a hard requirement plus a toleration for the taint:
# For critical workloads, on-demand only
spec:
  affinity:
    nodeAffinity:
      requiredDuringSchedulingIgnoredDuringExecution:
        nodeSelectorTerms:
          - matchExpressions:
              - key: workload-type
                operator: In
                values:
                  - critical
  tolerations:
    - key: dedicated
      operator: Equal
      value: critical
      effect: NoSchedule
Spot-tolerant work gets a soft preference, so it still schedules if the Spot pool is empty:
# For spot-tolerant workloads
spec:
  affinity:
    nodeAffinity:
      preferredDuringSchedulingIgnoredDuringExecution:
        - weight: 100
          preference:
            matchExpressions:
              - key: workload-type
                operator: In
                values:
                  - spot-tolerant
Why do you need a Pod Disruption Budget?
When a Spot node is reclaimed, Kubernetes drains it. Without a budget, a drain can take out every replica of a service at once. A PodDisruptionBudget sets the floor:
apiVersion: policy/v1
kind: PodDisruptionBudget
metadata:
  name: api-gateway-pdb
  namespace: production
spec:
  minAvailable: 2
  selector:
    matchLabels:
      app: api-gateway
This guarantees at least two api-gateway pods are running at all times, including during node drains. Set one for every service you put on a Spot pool.
How much does scheduling dev clusters save?
Dev and staging clusters running 24/7 is pure waste. A dev cluster up from 7 AM to 8 PM on weekdays runs about 283 of the 730 hours in a month, so it costs roughly 61% less than one running around the clock.
For EKS, scale the node group to zero outside working hours:
# Scale down at 8 PM
aws eks update-nodegroup-config \
  --cluster-name dev-cluster \
  --nodegroup-name dev-nodes \
  --scaling-config minSize=0,maxSize=3,desiredSize=0

# Scale up at 7 AM
aws eks update-nodegroup-config \
  --cluster-name dev-cluster \
  --nodegroup-name dev-nodes \
  --scaling-config minSize=1,maxSize=3,desiredSize=2
Automate it with a CronJob or a Lambda on an EventBridge schedule. Note that the EKS control plane bills whether or not any nodes exist, so scaling to zero cuts the node line and not the cluster fee.
What does the whole change add up to?
Take the 28-pod cluster from the start of this post back through each step, on m5.xlarge nodes in us-east-1 with about 3.92 allocatable vCPU each.
| Item | List price | Per node per month |
|---|---|---|
m5.xlarge on-demand |
$0.192/hr | $140.16 |
m5.xlarge on Spot, at a 60% discount |
up to 90% off on-demand | $56.06 |
Prices checked September 2026, us-east-1. Spot rates float with capacity, so 60% is a conservative working assumption rather than a quoted rate.
Starting point. 28 pods x 1000m requested = 28 vCPU. At 3.92 allocatable per node, that needs 8 nodes.
8 nodes x $140.16 = $1,121.28/monthAfter right-sizing requests. Set requests from measured P95 plus a buffer and the same pods request 200m each: 28 x 200m = 5.6 vCPU. That fits on 2 nodes.
2 nodes x $140.16 = $280.32/month
Saving:             $840.96/month (75%)
No pod moved, no service changed, nothing scaled down. The autoscaler removed six nodes because six nodes’ worth of reservation stopped existing.
After moving batch workers to Spot. If one of the two remaining nodes carries interruption-tolerant work and moves to a Spot pool at a 60% discount, its $140.16 becomes about $56.06, taking the cluster to roughly $196/month.
The order matters. Right-sizing first is what makes the node count small. Buying Spot or reservations first just locks in a discount on hardware you did not need.
Which Kubernetes cost mistakes are most common?
Setting requests equal to limits. This is the “Guaranteed” QoS class. It means no bursting and no flexibility: every pod gets exactly what it requests even when it uses 10% of it. Reserve Guaranteed QoS for your most latency-sensitive services.
Autoscaling on the wrong metric. HPA on CPU is fine for compute-bound services. If your service is I/O-bound, waiting on database queries or external APIs, CPU stays low even when the service is overloaded. Scale on request latency or queue depth instead.
Using container_memory_usage_bytes. It includes filesystem cache, which inflates memory numbers and leads you to over-request. Always right-size against container_memory_working_set_bytes, which reflects actual application memory.
Skipping namespace resource quotas. Without quotas, one team can claim all cluster resources by accident:
apiVersion: v1
kind: ResourceQuota
metadata:
  name: team-api-quota
  namespace: team-api
spec:
  hard:
    requests.cpu: "4"
    requests.memory: "8Gi"
    limits.cpu: "8"
    limits.memory: "16Gi"
What should you do first?
Run kubectl top pods --containers across your namespaces right now and compare the output to your resource requests. The gap between those two numbers, multiplied by your node price, is what you’re overpaying.
Closing it is configuration work rather than architecture. Tedious, unglamorous configuration work, with a node count on the other side of it that you can price directly against the table above.
If you want continuous visibility into that gap without manually querying Prometheus, Xplorr tracks resource efficiency across your clusters and flags overprovisioned workloads automatically. But even without tooling, start measuring.
Keep reading
- AWS Cost Optimization Strategies That Actually Work
- GCP Cost Optimization Guide: Practical Strategies
- Cloud Cost Optimization for Startups: A Guide by Stage
See how Xplorr helps → Features
Xplorr shows your AWS, Azure and GCP spend in one place, with anomaly detection, budgets and rightsizing recommendations. Get started free.
Written by
Xplorr team
The people who build Xplorr
Written together by the engineers who build Xplorr: the AWS, Azure, GCP and Kubernetes collectors, the console, and the alerting behind them.
About Xplorr