Kubernetes Requests vs Usage: What Unused Requests Cost per Workload
Kubernetes requests vs usage: why you pay for requested CPU and memory, how to measure the gap per workload, price it per month, and pick a lower request.

Xplorr team
The people who build Xplorr

In this post
Ask a platform team what their Kubernetes cluster costs and they can give you a number. Ask what a single workload wastes and most cannot.
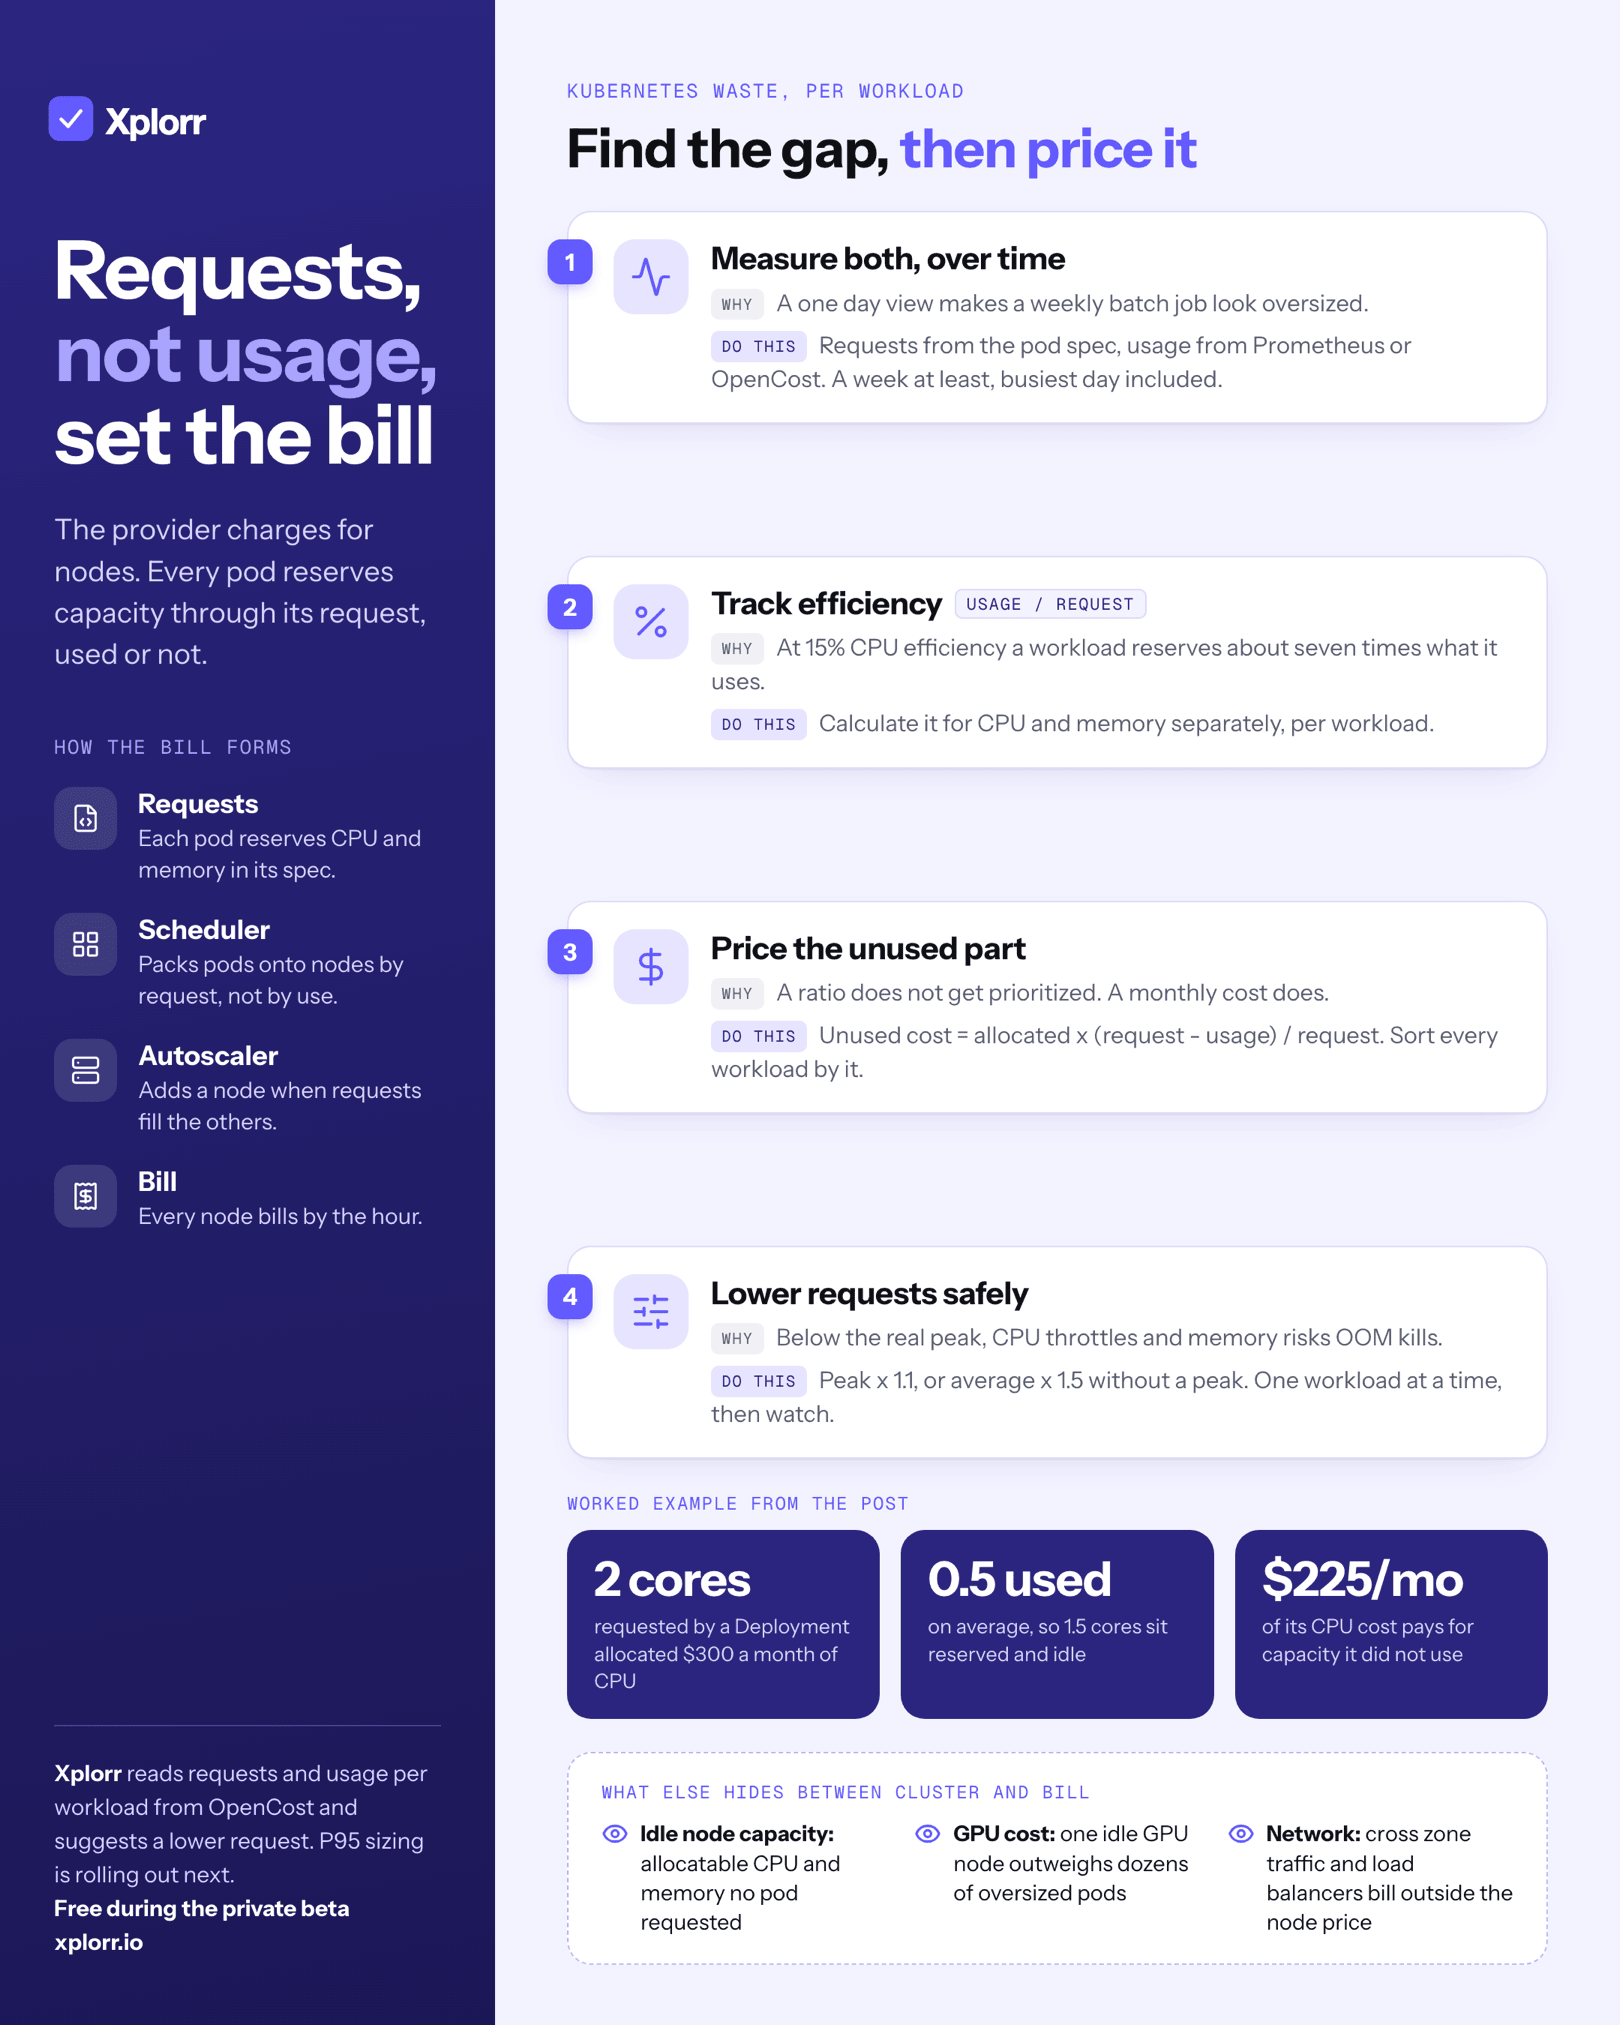
The reason is how Kubernetes turns into a bill. The cloud provider charges for nodes, not pods. But every pod reserves CPU and memory through its request, whether or not it uses that capacity. A workload that requests 2 CPU and uses 0.3 is not free. It holds capacity the scheduler cannot give to anything else, and someone pays for the node that capacity sits on. The gap between requests and usage, per workload, is where most cluster waste lives.
Why do requests, not usage, decide what a cluster costs?
The scheduler places pods by their requests. A node with 8 allocatable CPU fits pods whose requests add up to 8, even if together they use 2. When requests fill the nodes, the cluster autoscaler adds another node, and that node bills by the hour.
So usage decides how busy the nodes are, but requests decide how many nodes you run. Lowering usage without lowering requests saves nothing. Lowering requests toward real usage lets pods pack onto fewer nodes, and the autoscaler removes the rest.
Limits are a separate question. They cap what a container may use and protect neighbours, but they do not reserve anything, so they do not drive node count.
How do you measure requests vs usage per workload?
You need both numbers per workload, over time, not a single snapshot:
- Requests come from the pod spec. Sum them per Deployment, StatefulSet or DaemonSet.
- Usage comes from metrics:
kubectl top podgives a current reading from metrics server, but a right sizing decision needs history. Prometheus with cAdvisor metrics, or OpenCost (which builds on them), gives CPU and memory usage per container over days or weeks.
Look at a week at least, and include your busiest day. A batch job that idles six days and peaks on the seventh will look oversized on a one day view.
The ratio worth tracking is efficiency = usage / request, for CPU and memory separately. A workload at 15% CPU efficiency is reserving roughly seven times what it uses. Memory efficiency tends to be higher, because memory is harder to reclaim and teams size it more carefully.
How do you turn the gap into a dollar figure?
A ratio does not get prioritized. A monthly cost does. The allocation approach OpenCost uses gives a defensible way to price the gap:
unused cost = workload cost x max(0, requested - used) / allocatedHere allocated is what the workload is charged for (the larger of request and usage), and the calculation runs separately for CPU and memory. The result is the part of the workload’s cost that paid for capacity it did not use.
As an example, a Deployment allocated $300 a month of CPU, requesting 2 cores and using 0.5 on average, has an unused CPU cost of $300 x 1.5 / 2 = $225 a month. Sort every workload by that figure and the list tells you where to start. It is usually a handful of services, not the whole cluster.
How do you choose a lower request?
Do not set the request to the average. Averages hide peaks, and a CPU request below the real peak means throttling under load, while a memory request below the peak risks eviction or OOM kills when nodes fill up.
A practical rule is to size from the observed peak plus headroom, for example peak x 1.1, over a window that includes your busiest traffic. If you only have averages, add more headroom (average x 1.5 is a reasonable start). A high percentile such as P95 is a good middle ground once you have enough history: it ignores one off spikes without sizing to the average.
Then change requests gradually, one workload at a time, and watch throttling, restarts and latency for a few days before the next step. The Vertical Pod Autoscaler can make recommendations in its “Off” mode without applying them, which is a safe way to compare its numbers with yours.
What else hides between the cluster and the bill?
Requests are the largest source of waste, but not the only one:
- Idle node capacity: allocatable CPU and memory no pod requested. Often a sign of node types that do not fit the workload shape.
- GPU cost: GPU nodes are expensive enough that a single idle one matters more than dozens of oversized pods.
- Network: cross zone traffic between pods and load balancer charges bill outside the node price.
How Xplorr shows requests vs usage
Once a cluster is connected, Xplorr reads requested and used CPU and memory per workload from OpenCost, either through a Helm chart that installs OpenCost and a small collector, or by calling an OpenCost you already run. For each workload it shows efficiency, the monthly cost of the unused part using the formula above, and a suggested lower request (peak x 1.1, or average x 1.5 when there is no peak). The same view shows GPU cost per workload, network cost split into cross zone, cross Region, internet and load balancer traffic, and node efficiency with idle cost per node. Sizing on P95 usage rather than the peak is rolling out next.
It sits next to the cloud bill that pays for the nodes, so the cluster total can be checked against what AWS, Azure or GCP charged. See Kubernetes cost monitoring for the setup, Kubernetes cost allocation for splits by namespace and label, and Xplorr vs Kubecost if you are choosing between tools. Xplorr is free during the private beta.
Keep reading
- Kubernetes Cost Optimization: Cutting Pod and Node Spend
- Hidden Cloud Costs You’re Probably Missing Right Now
- What Building Cloud Cost Integrations Actually Teaches You
See how Xplorr helps → Features
Written by
Xplorr team
The people who build Xplorr
Written together by the engineers who build Xplorr: the AWS, Azure, GCP and Kubernetes collectors, the console, and the alerting behind them.
About Xplorr