What It Costs to Run a Multi-Cloud FinOps Platform: Our Own Stack, Itemised
Xplorr's own infrastructure read out of its Helm chart: eight workloads, six CronJobs, eleven health checks, the datastores and the third-party services.

Xplorr team
The people who build Xplorr
In this post
- What actually runs in the cluster?
- How much CPU and memory does the platform reserve?
- What happens when autoscaling kicks in?
- What do the scheduled jobs do, and when?
- Where does the data actually live?
- Which third-party services are in the picture?
- What does CI and the registry cost?
- Which parts dominate, and which are rounding errors?
- What this post deliberately does not tell you
This is the infrastructure behind Xplorr, read out of our own Helm chart: eight workloads on a single k3s cluster, six scheduled jobs, eleven health checks, Postgres and Redis running outside the chart, and around nine third-party services. Total reserved CPU is 1,010 millicores. There is no invoice total here, because the anatomy is the part worth publishing.
Everything below comes from two places: the Helm chart that deploys the platform, and the service code that the chart runs. Where a vendor publishes a list price we link the pricing page and label it as list price. Where we do not know a number, we say the component exists and leave the number out. That is a less satisfying post than a fake invoice, and a more useful one.
What actually runs in the cluster?
Eight long-running workloads, all on one k3s cluster in a single namespace. Four of them are the backend: auth-service on port 3001, cloud-sync-service on 3002, optimization-service on 3003, reporting-service on 3004. The Next.js console runs as frontend on 3000. Then there is the MCP server on 3005, the Slack and Teams bot, and a Gatus instance serving the status page.
Only two of those run more than one replica. auth-service and frontend are set to two each in the production values file; everything else is a single replica. That is a deliberate choice about which failures are visible to a user. Losing a login or a page render is immediate and obvious. Losing the cost sync for one cycle is a job that reruns at 02:00 UTC tomorrow, so it does not buy a second pod.
How much CPU and memory does the platform reserve?
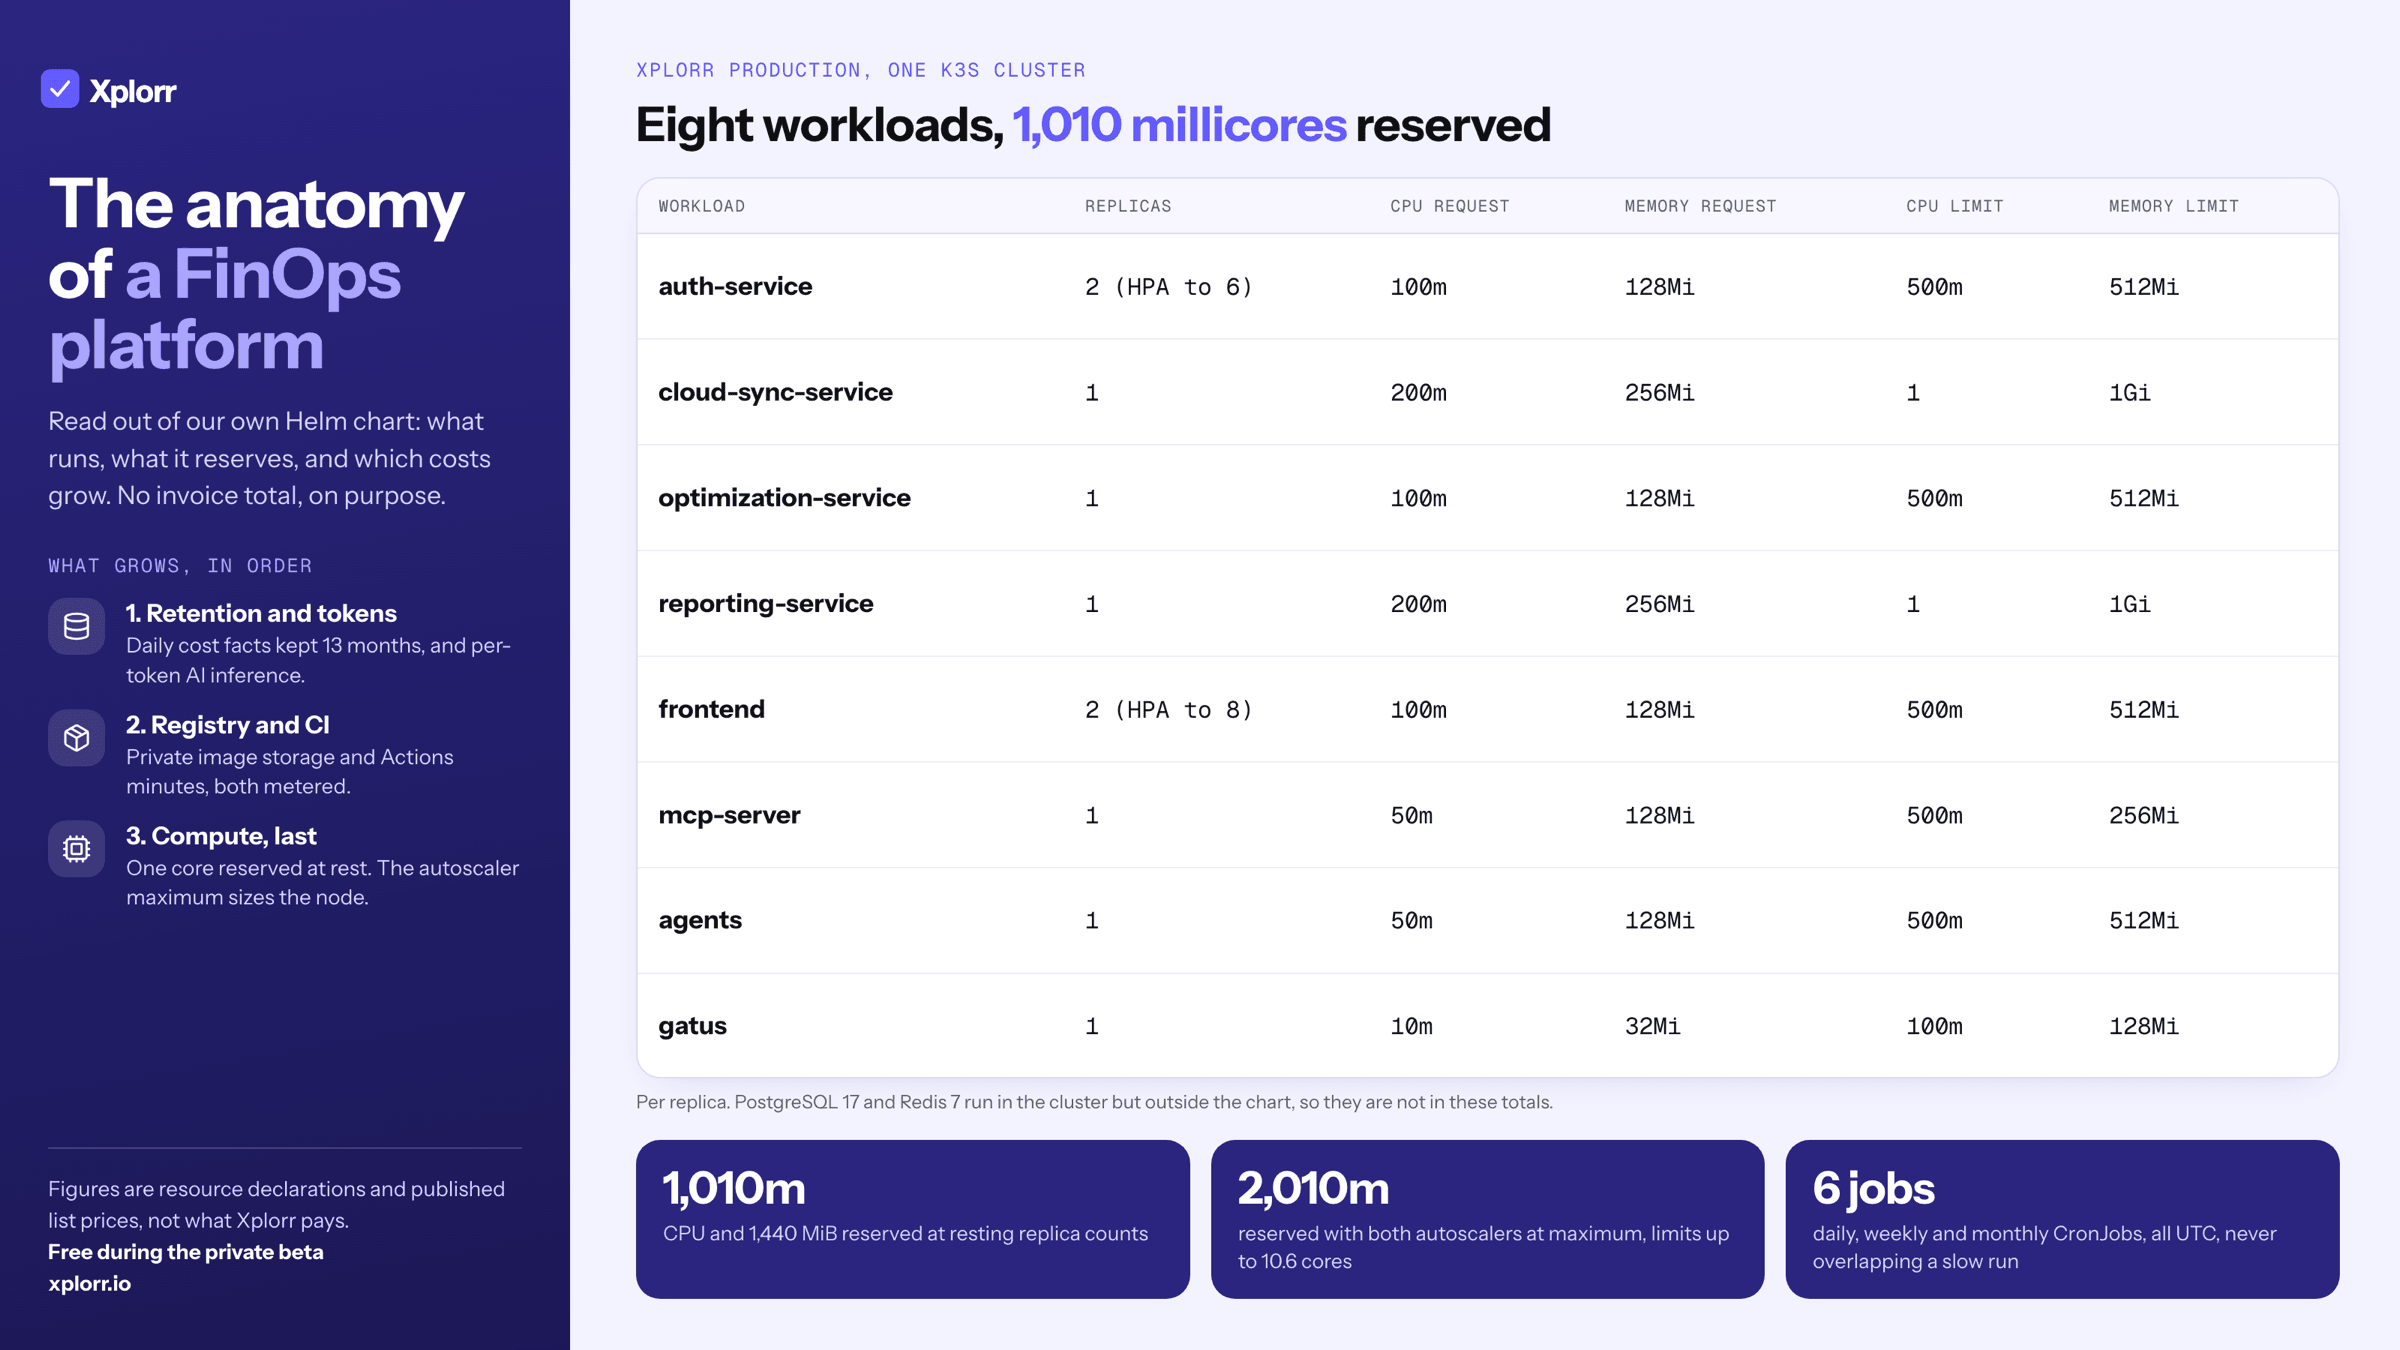
At the configured replica counts, the eight workloads request 1,010 millicores and 1,440 MiB. They are allowed to burn up to 5,600 millicores and 5,504 MiB. So the whole platform reserves slightly more than one CPU core and about 1.4 GiB, with headroom to roughly five and a half cores under load.
| Workload | Replicas | CPU request | Memory request | CPU limit | Memory limit |
|---|---|---|---|---|---|
| auth-service | 2 | 100m | 128Mi | 500m | 512Mi |
| cloud-sync-service | 1 | 200m | 256Mi | 1 | 1Gi |
| optimization-service | 1 | 100m | 128Mi | 500m | 512Mi |
| reporting-service | 1 | 200m | 256Mi | 1 | 1Gi |
| frontend | 2 | 100m | 128Mi | 500m | 512Mi |
| mcp-server | 1 | 50m | 128Mi | 500m | 256Mi |
| agents | 1 | 50m | 128Mi | 500m | 512Mi |
| gatus | 1 | 10m | 32Mi | 100m | 128Mi |
The two services that ingest and export data, cloud-sync-service and reporting-service, get double the request and double the ceiling of the others. That is the shape you would expect: pulling a month of Cost Explorer pages or building an Excel export is the only work here that is genuinely memory hungry.
What happens when autoscaling kicks in?
Two HorizontalPodAutoscalers are enabled, both targeting 70% CPU. auth-service scales from 2 to 6 replicas and frontend from 2 to 8. Nothing else autoscales.
Fully stretched, that moves reserved CPU from 1,010 to 2,010 millicores and the limit ceiling from 5.6 to 10.6 cores. Memory limits go from 5,504 MiB to 10,624 MiB. So the difference between the quiet state and the maximum the cluster must be able to absorb is roughly a factor of two on requests and a factor of two on limits.
This matters for capacity planning in a way the average number does not. A node pool sized for 1,010 millicores of requests will schedule the platform perfectly and then refuse to place the seventh auth pod at exactly the moment you need it. The number to buy against is the autoscaler maximum, not the resting state.
What do the scheduled jobs do, and when?
Six CronJobs, all pinned to timeZone: "UTC" with concurrencyPolicy: Forbid, so a slow run never overlaps the next one.
| CronJob | Schedule | What it does |
|---|---|---|
| cloud-sync | 0 2 * * * |
Pulls cost, inventory and usage data from connected accounts |
| data-retention | 0 3 * * * |
Deletes rows past their retention window |
| alert-check | 0 8 * * * |
Evaluates alert rules and budget thresholds |
| onboarding-drip | 0 9 * * * |
Triggers the onboarding email sequence |
| monthly-reports | 0 6 1 * * |
Sends monthly reports on the first of the month |
| founder-digest | 0 9 * * 1 |
Posts the weekly internal digest, Mondays |
Three of these reuse their parent service’s resource block rather than declaring their own. The sync job runs with the same 1 core and 1 GiB ceiling as cloud-sync-service itself. Two of them, the drip and the digest, are thin HTTP callers that request 10 millicores and 32 MiB, because all they do is POST to an internal endpoint and print the response.
The sync job also carries activeDeadlineSeconds: 7200 and backoffLimit: 2. A two hour ceiling on a nightly job is a statement about how long a full multi-account pull can legitimately take.
Where does the data actually live?
PostgreSQL 17 and Redis 7, both running in the cluster but both outside this chart. The production values set postgres.enabled: false and redis.enabled: false and point at postgresql.postgresql.svc.cluster.local:5432 and redis-master.redis.svc.cluster.local:6379. So neither appears in the resource totals above, and anyone reading only the chart would undercount the cluster.
Persistent storage is small. The chart provisions a 1 GiB volume for Gatus history, and a 20 GiB Postgres volume when the chart manages Postgres, which in production it does not.
Database growth is the one cost here that compounds, which is why the retention job exists and why its policy is explicit rather than a default. Audit logs are kept 90 days. Sync job records 30 days. Revoked or expired refresh tokens 7 days. Alert and anomaly events 90 days. The four daily fact tables, cost_data, resource_costs, network_costs and coverage_data, are kept 13 months, because a year over year comparison needs 13 points, not 12.
Which third-party services are in the picture?
Nine, and they split cleanly into things that scale with usage and things that do not.
Metered by usage: the OpenAI API for AI recommendations and the chat agent, defaulting to gpt-4o with gpt-4o-mini as the fast model. List price at the time of writing is $2.50 per million input tokens and $10.00 per million output tokens for gpt-4o, and $0.15 and $0.60 for gpt-4o-mini. The code also supports OpenRouter and Amazon Bedrock as alternative providers, so this line is substitutable rather than fixed.
Flat or free tier: Resend for transactional email, whose free tier is 3,000 emails a month capped at 100 a day, with Pro from $20. Sentry for error monitoring, present in all four backend services and the frontend, with a free Developer tier at 5,000 errors and Team from $26. Netlify hosts the marketing site and the docs site, with a free plan and Pro at $20. Cloudflare provides the tunnel and the Zero Trust access policy in front of the console; plan tiers are published here and we are not quoting a figure we have not verified. Analytics runs through PostHog in the console and Plausible plus Google Analytics on the marketing site. QuickChart renders the charts embedded in Slack digests.
What does CI and the registry cost?
Container images are built by GitHub Actions and pushed to GHCR as ghcr.io/xplorrio/xplorr-<service>. Seven images, one per workload we build ourselves. Five of them come out of the main monorepo and every commit on its main branch carries a sha- tag for all five; the MCP server and the chat agent are built by their own repositories on their own cadence, which is why the chart pins their tags separately.
Both sides of that are metered. GitHub Actions includes 2,000 minutes a month on the Free plan, and every job bills a whole minute regardless of how long it ran, which is why our workflow diffs the commit and only builds the workspaces a change actually touched. GitHub Packages is free for public packages; private ones get 500 MB of storage and 1 GB of transfer a month on Free, billed hourly beyond that. Our images are private and pulled with a registry secret, so the tag retention policy is a real cost lever and not housekeeping.
Which parts dominate, and which are rounding errors?
Compute is not the interesting number. A platform that reserves one core and 1.4 GiB at rest will fit on hardware you would not think twice about. The autoscaler ceiling of 10.6 cores is the number that sizes the node, and it is still small.
The parts that grow are the parts tied to how much data you keep and how many tokens you spend. Daily cost facts across four tables for every connected account, held for 13 months, is the one line that gets monotonically larger without anyone deciding it should. AI inference is the other, because it scales with how often people ask questions rather than with how many services you run. Everything else on this list is a flat monthly plan or a free tier.
If you are costing a platform like this, that is the ranking worth internalising: storage retention and per-token inference first, registry and CI minutes second, compute last. If your own product calls OpenAI or Anthropic, Xplorr’s AI spend view puts that per-token cost next to the cloud bill it runs on.
What this post deliberately does not tell you
It does not tell you what Xplorr pays. Every figure above is either a resource declaration in our own chart or a published vendor list price, and the two are not the same as an invoice. The k3s cluster runs on hardware whose cost is not in any repo, so it is not here either. Plan selection, negotiated rates and actual usage against each metered service are all absent on purpose.
That is the honest version. An itemised anatomy with named gaps is more useful to someone sizing their own build than a total with invented components inside it.
Related reading:
Written by
Xplorr team
The people who build Xplorr
Written together by the engineers who build Xplorr: the AWS, Azure, GCP and Kubernetes collectors, the console, and the alerting behind them.
About Xplorr