Why Multi-Cloud Cost Visibility Is Broken (And How to Fix It)
AWS, Azure, and GCP each have their own billing console. Why multi-cloud cost visibility is broken, and how a unified cloud cost management dashboard fixes it.

Xplorr team
The people who build Xplorr
In this post
Multi-cloud cost visibility is broken because AWS, Azure and GCP each bill through a separate console with its own data model, service taxonomy, export format and refresh cadence. None of it reconciles on its own. The fix is a layer above the three consoles that normalizes billing data into one schema, one set of allocation dimensions and one alerting path.
That is a tooling problem, not a people problem, and most teams have quietly learned to live with it.
Why Don’t Three Billing Consoles Add Up?
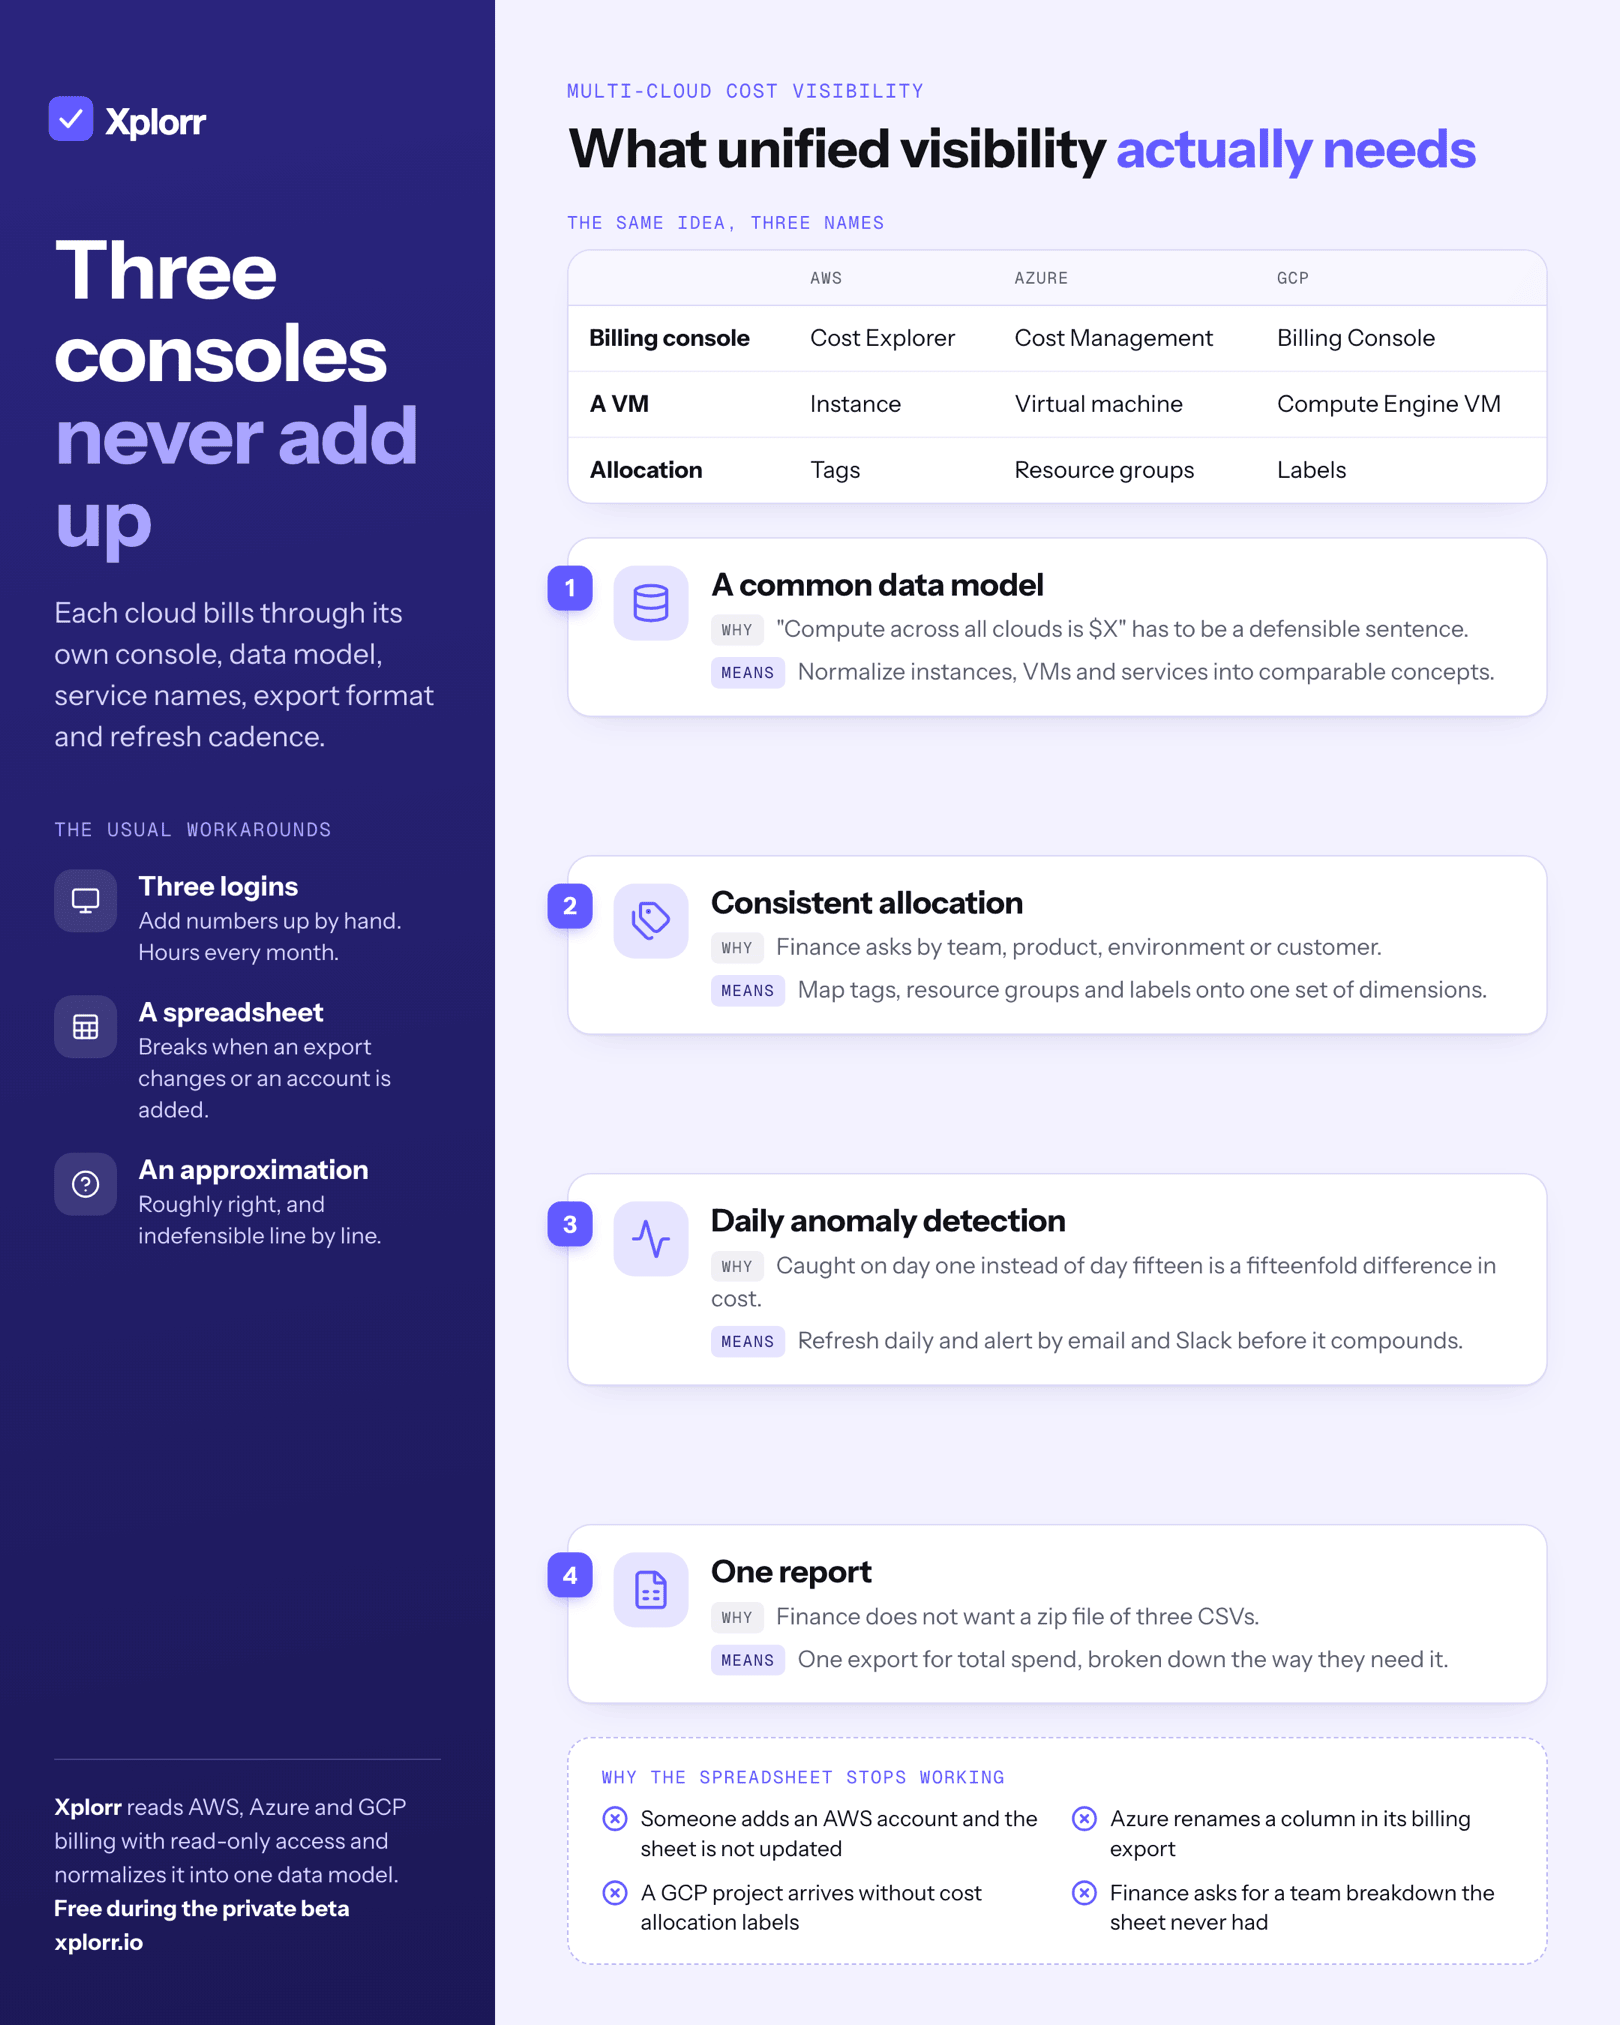
AWS Cost Explorer, Azure Cost Management and the GCP Billing Console are each competent tools for their own cloud. The problem is that they share nothing: different data models, different definitions of a “service”, different export formats, different refresh rates.
So answering “what is our total cloud spend this month?” means doing one of three things:
- Logging into three consoles and adding up numbers by hand, hoping you are comparing like with like
- Exporting CSVs from each platform, reshaping them into a common format, and maintaining a spreadsheet somebody is nominally responsible for
- Approximating, giving finance a number you know is roughly right but cannot defend line by line
None of these scale. Option 1 costs hours every month. Option 2 breaks whenever a provider changes an export format, which happens regularly. Option 3 is a liability waiting to become a conversation you do not want to have.
Why Do Cost Spreadsheets Stop Scaling?
The spreadsheet approach is deceptively appealing. You build it once, it works for a few months, and then it starts breaking:
- Someone adds a new AWS account and forgets to update the sheet
- Azure renames a column in their billing export
- A new GCP project is created without cost allocation labels, and the numbers stop adding up
- Finance wants a breakdown by team and the sheet has no such dimension
By the time it handles all those edge cases it is a 3,000-row artifact that one person understands. When that person goes on holiday, cost reporting stops.
What Does Fragmented Visibility Actually Cost?
Beyond the time spent every month, fragmented visibility has a harder-to-measure cost: delayed detection.
When billing data lives in three separate places and each one gets looked at every few weeks, things slip through. A Lambda function that starts processing 100x its normal volume at 2am on a Tuesday runs unnoticed until someone opens the right console.
In a unified system with anomaly detection, that same event triggers an alert within hours. Catching it on day one instead of day fifteen is a fifteenfold difference in what it costs, and the arithmetic is the same for every runaway resource.
What Does Real Multi-Cloud Visibility Require?
“All three clouds in one dashboard” is table stakes. Four things sit underneath it.
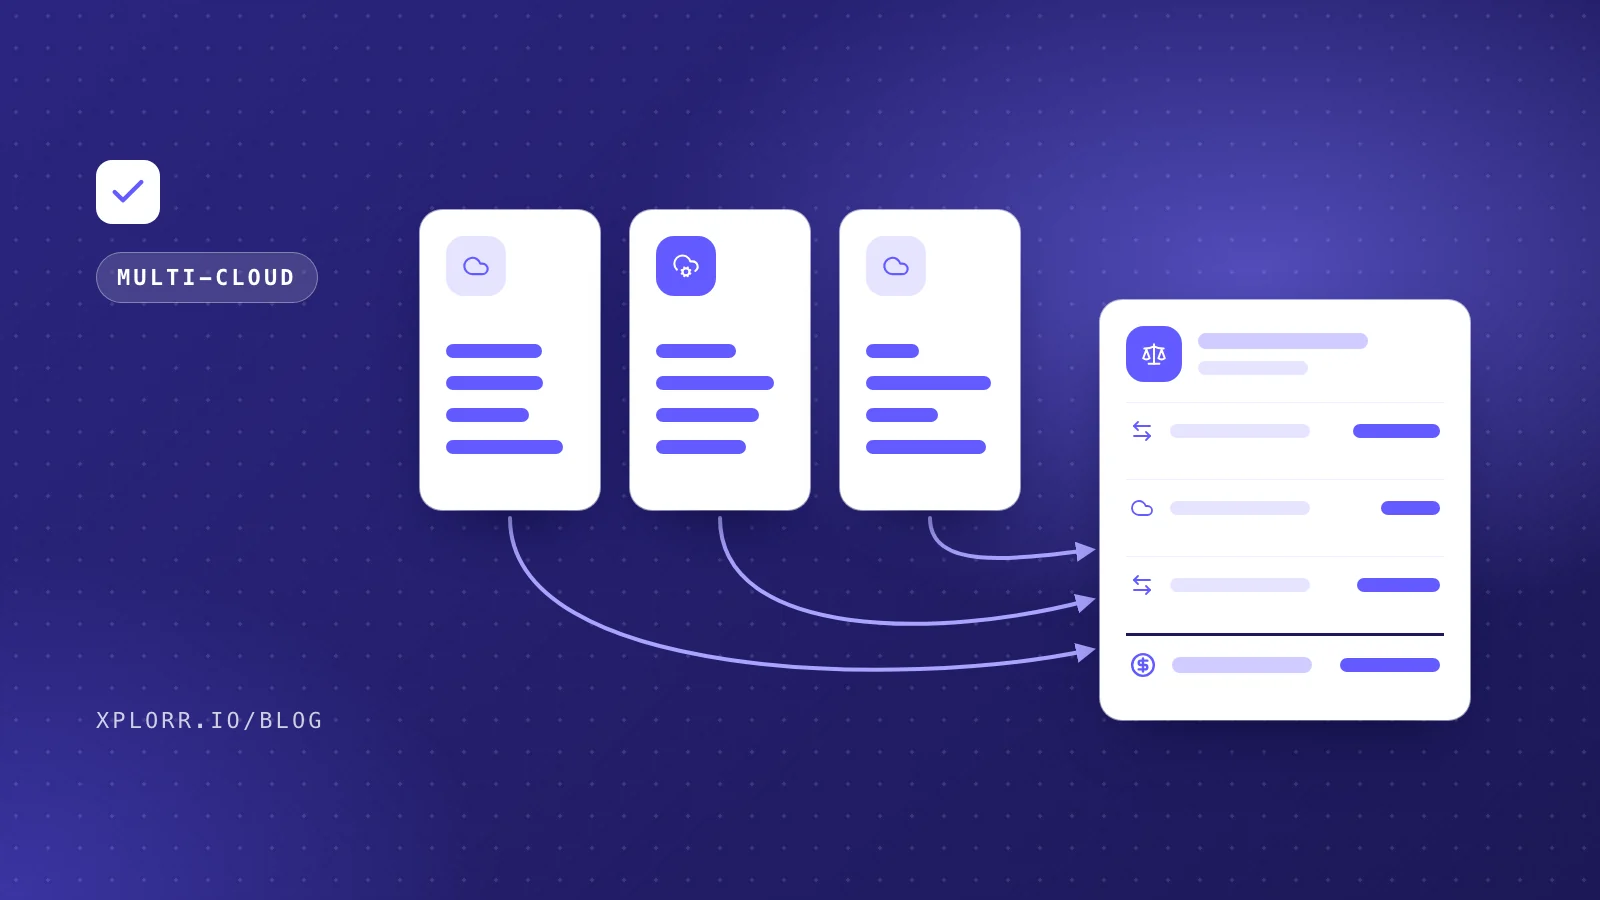
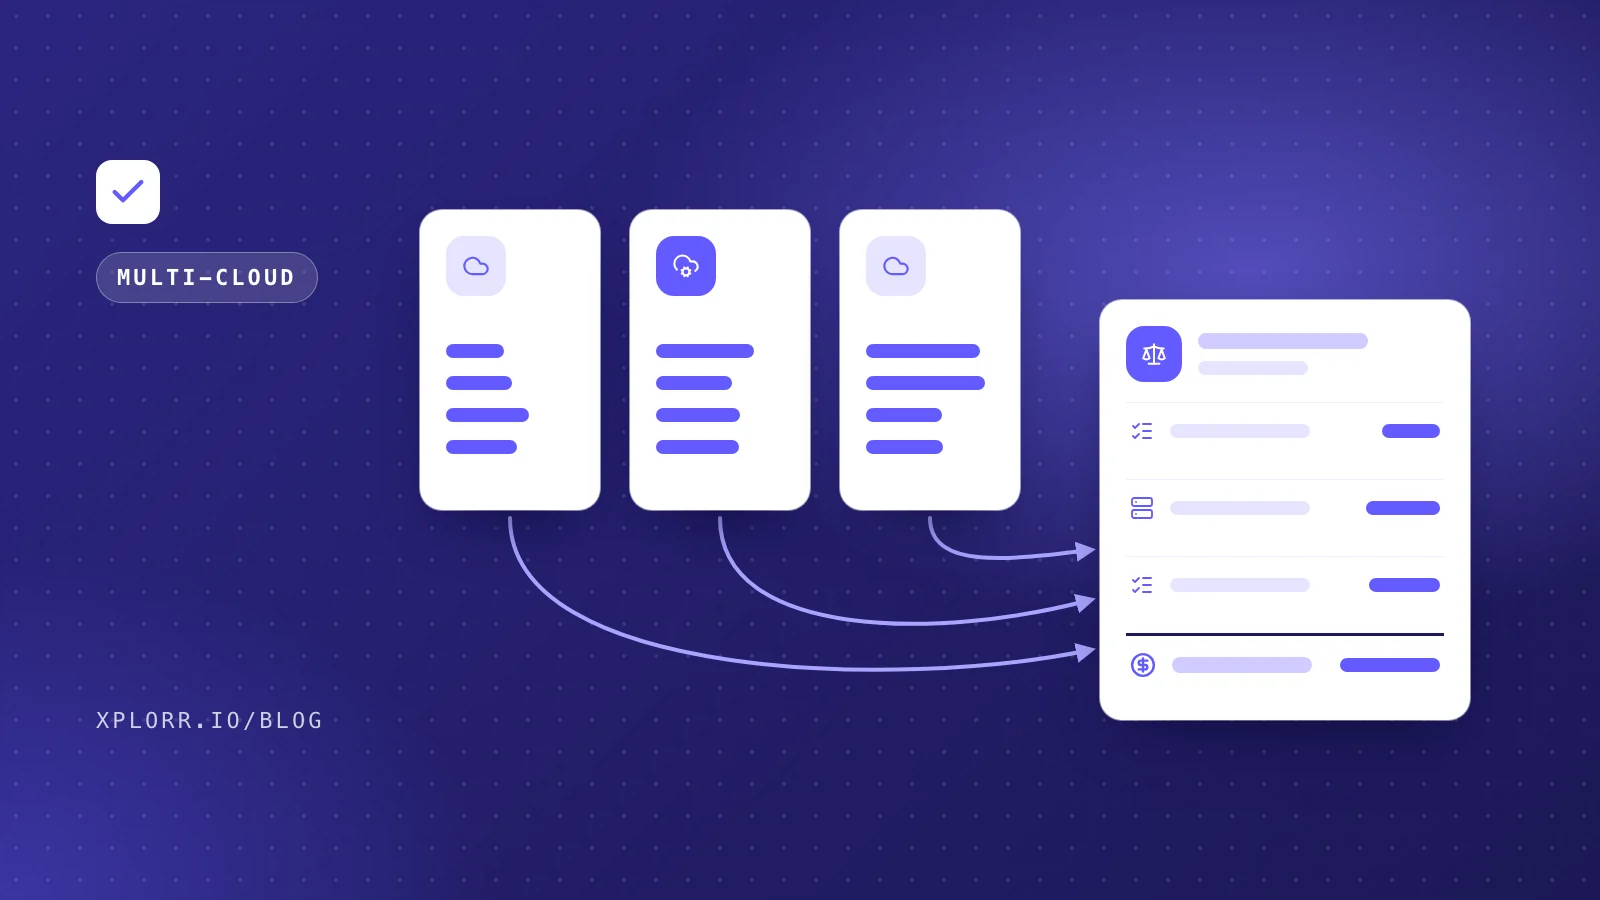
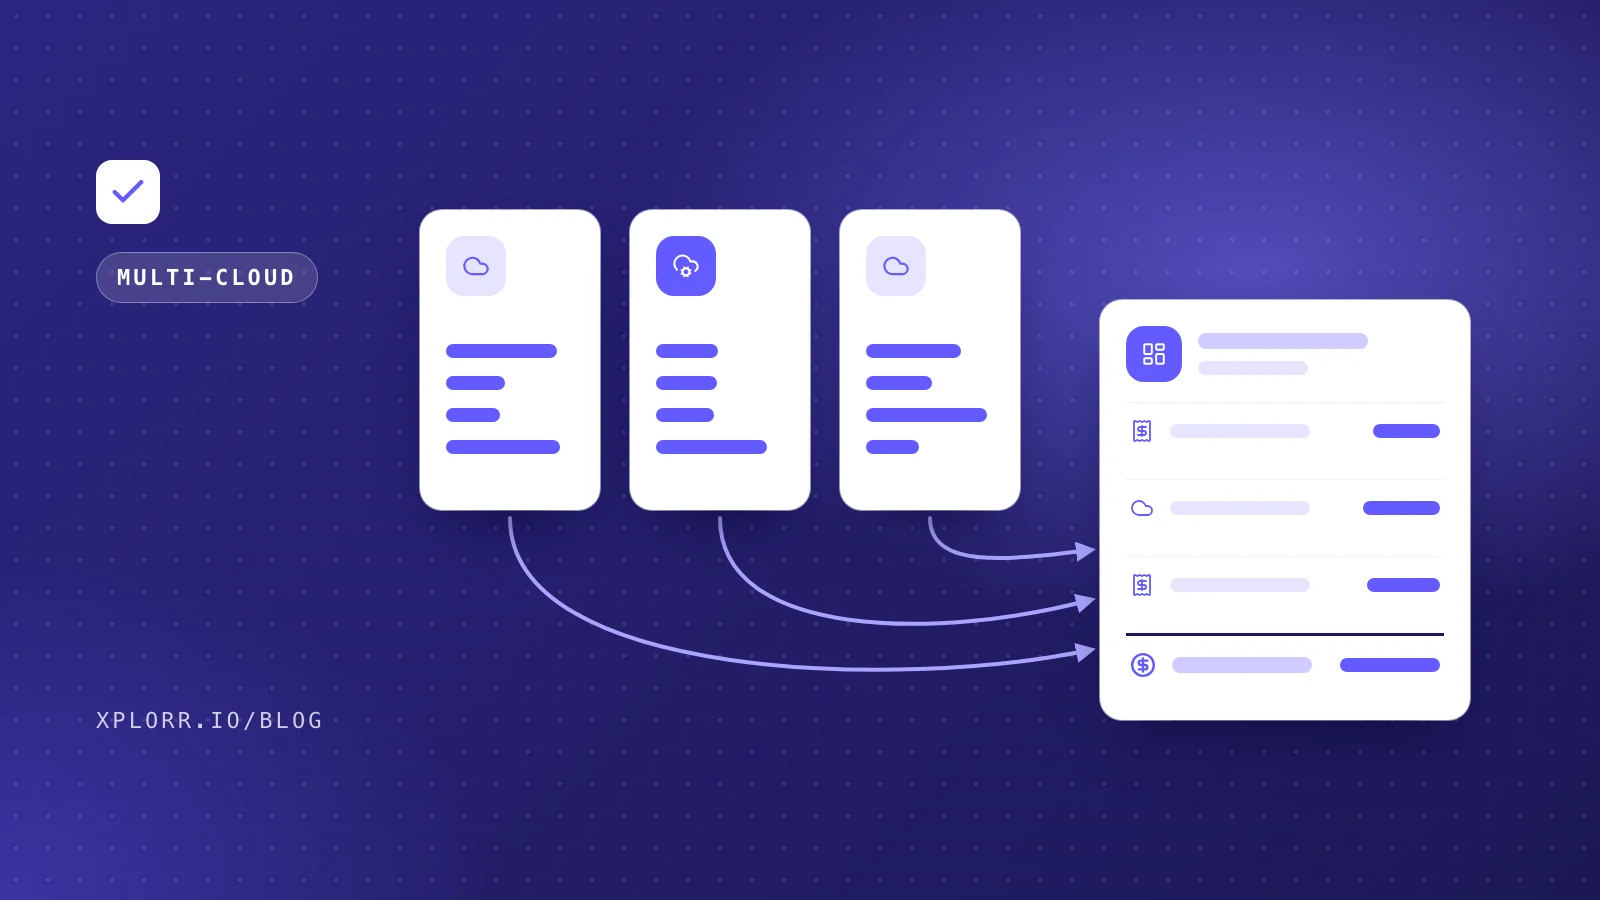
1. A common data model. AWS calls it an “instance”. GCP calls it a “Compute Engine VM”. Azure calls it a “virtual machine”. Unified visibility means normalizing those into comparable concepts so that “compute across all clouds is $X” is a defensible sentence.
2. Cost allocation consistency. Tags and labels are the connective tissue of attribution. That means mapping AWS tags, Azure resource groups and GCP labels onto one set of business dimensions: team, product, environment, customer. In Xplorr that is cost allocation, which splits spend by tag, team and account across all three providers.
3. Anomaly detection on a daily cadence. Historical data is for planning. Data refreshed daily with automated anomaly detection is what catches problems before they become invoice surprises.
4. One export and reporting flow. Finance does not want a zip file with three CSVs. They want one report covering total cloud spend, broken down the way they need it. Xplorr’s reports export CSV, Excel or PDF for any date range.
How Does Xplorr Unify AWS, Azure and GCP Billing?
Xplorr pulls billing data from all three major clouds over read-only API access, normalizes it into a common data model, and surfaces it in a single dashboard that updates daily. The integrations with AWS, Azure, and GCP use read-only credentials, so Xplorr can read your billing data but cannot modify or provision anything in your accounts.
Anomaly detection runs automatically. When any service on any account spends significantly more than its 7-day rolling average, an alert goes out by email and Slack before it compounds.
Reports are one click: PDF or Excel, any date range, broken down by provider, service, region or cost allocation tag. See the full list of features for what is available across all three providers.
Connect your accounts with read-only IAM permissions, Xplorr pulls your first month of data, and you have a baseline after the first sync.
Multi-cloud cost visibility does not have to be broken. Fixing it takes a tool built for the problem rather than three tools joined with spreadsheet glue.
Xplorr shows your AWS, Azure and GCP spend in one place, with anomaly detection, budgets and rightsizing recommendations. Get started free.
Keep reading
- Multi-Cloud Cost: When a Second Cloud Helps and When It Hurts
- AWS vs Azure vs GCP Pricing in 2026: Which Cloud Is Cheapest?
- Hidden Cloud Costs You’re Probably Missing Right Now
See how Xplorr helps → Features
Written by
Xplorr team
The people who build Xplorr
Written together by the engineers who build Xplorr: the AWS, Azure, GCP and Kubernetes collectors, the console, and the alerting behind them.
About Xplorr