Why Did My AWS Bill Go Up? Five Questions That Find the Cause
Why did my AWS bill go up? Five questions that find the cause of a cost spike: what rose, when it started, what changed, who changed it, and the cost per day.

Xplorr team
The people who build Xplorr
In this post
When a cloud bill jumps, the first instinct is to open the bill. It is the last place the answer is. The bill tells you that EC2 went up. It does not tell you that someone raised an autoscaling maximum on Tuesday afternoon, or that a new log group started ingesting debug output after a release.
Finding the cause is a short investigation, and it goes faster with the same five questions every time. They work for AWS, Azure, GCP and Kubernetes. The examples below use AWS, since that is where most people ask the question.
1. What exactly rose?
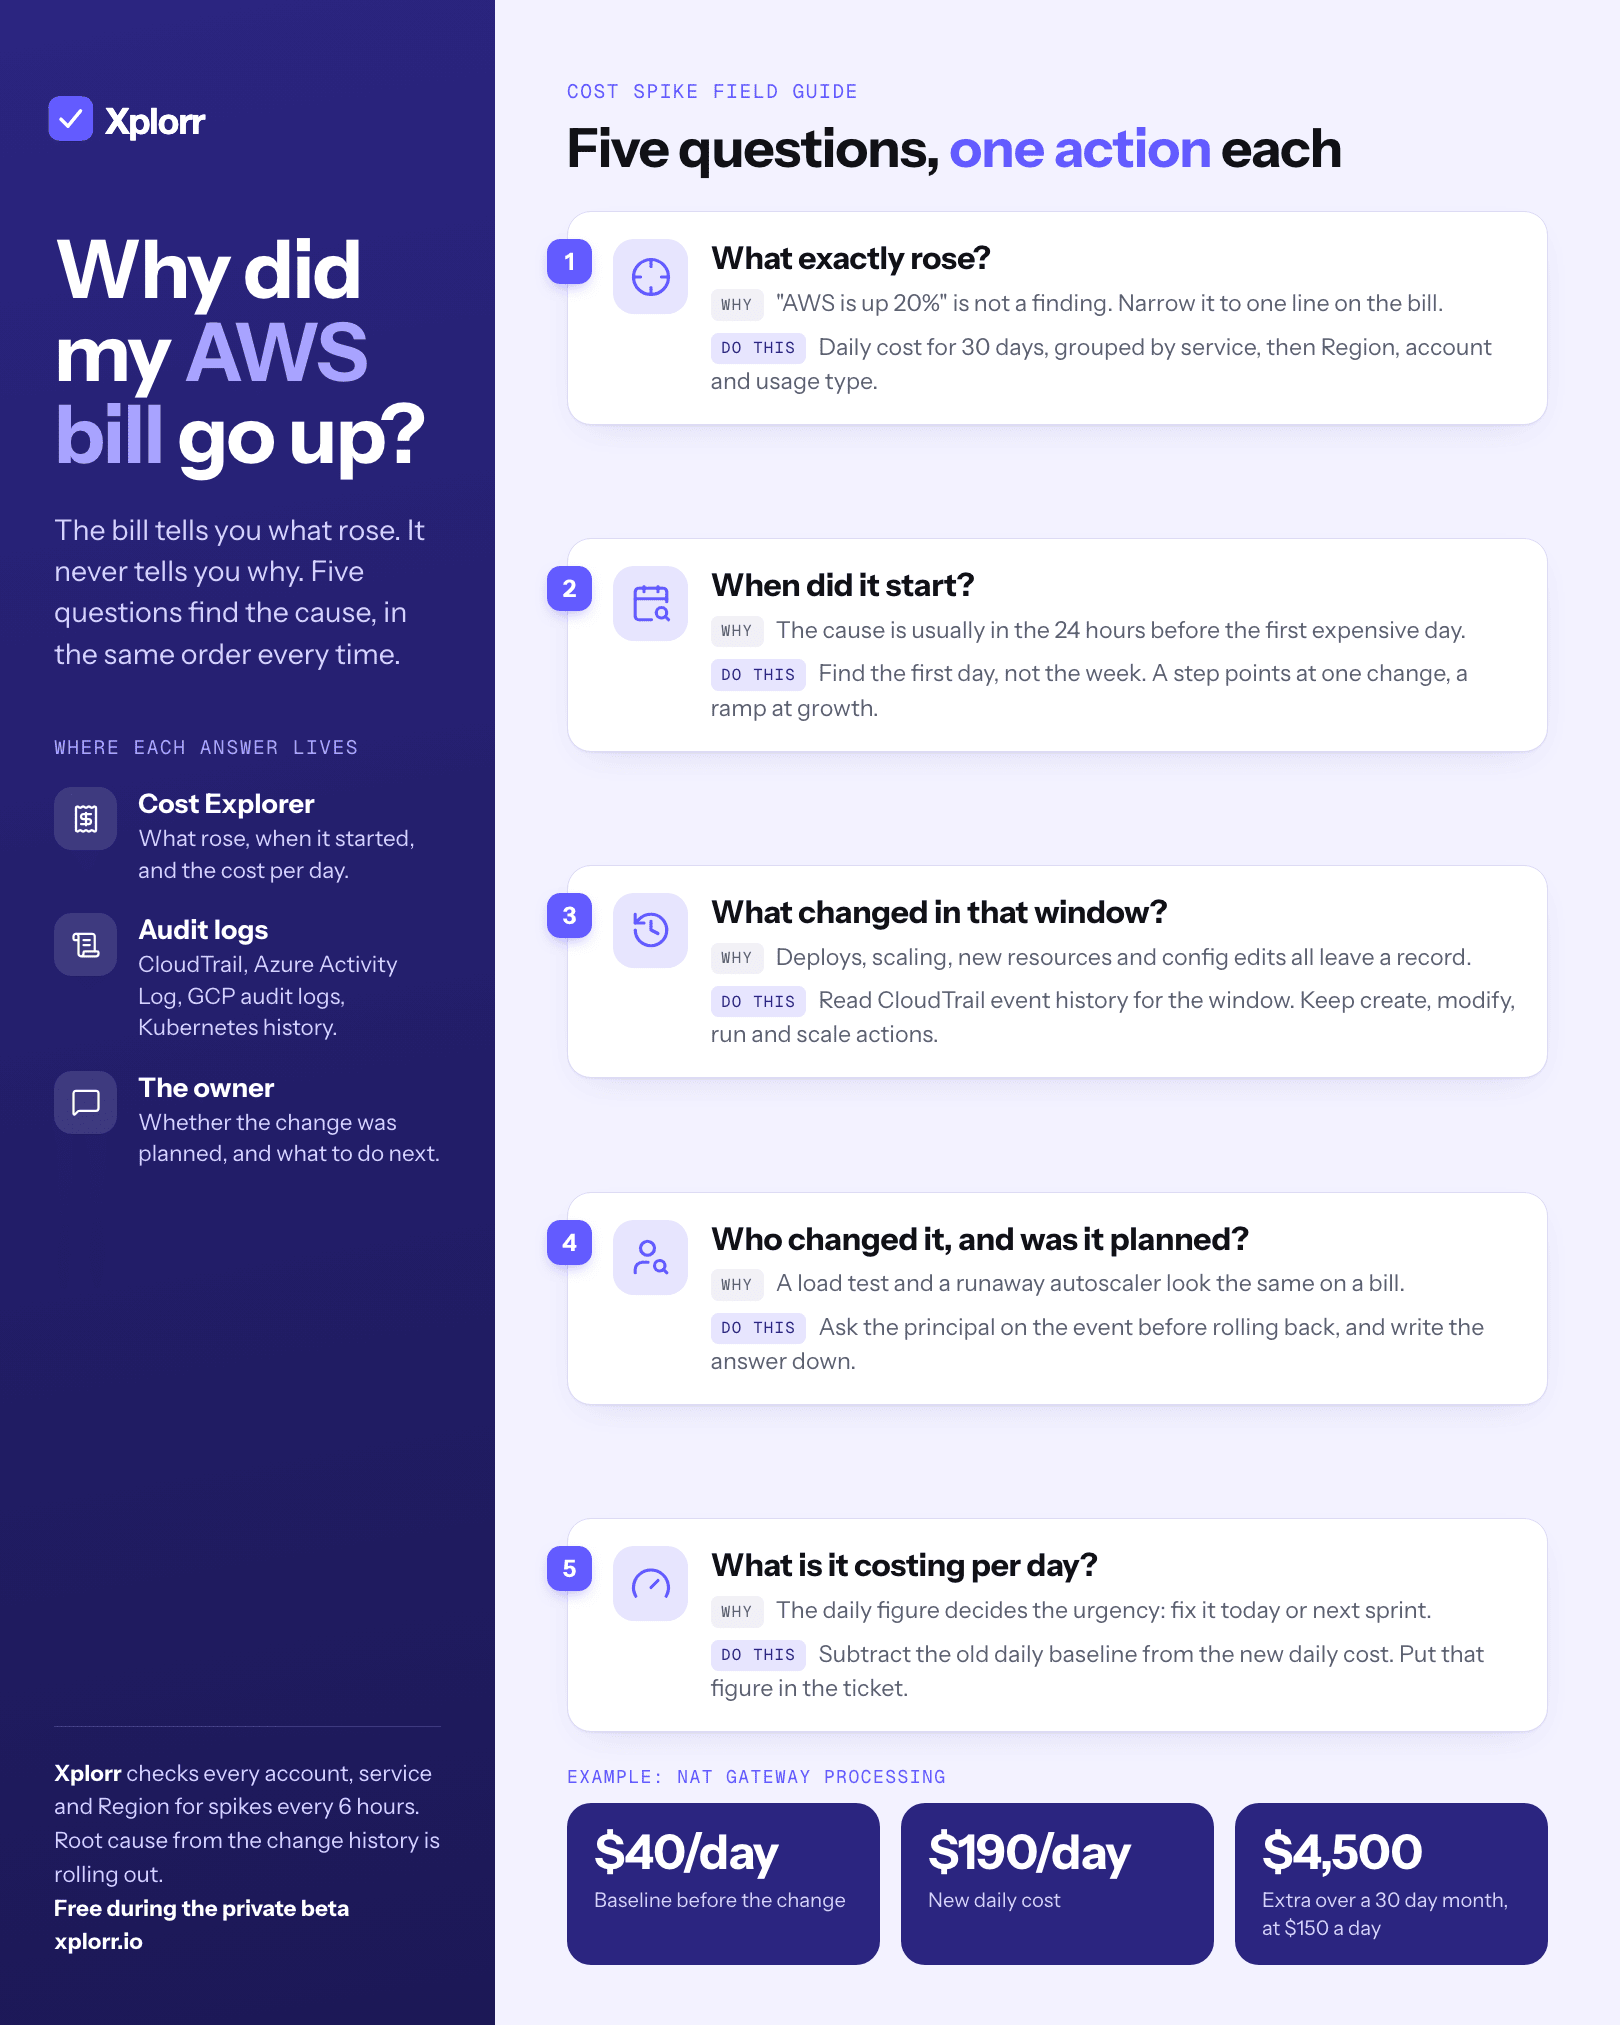
“AWS is up 20%” is not a finding. Narrow it to one service, one Region and one account before doing anything else.
In Cost Explorer, set daily granularity for the last 30 days, group by Service, and find the line that moved. Then filter to that service and group by Region, then by Linked account, then by Usage type. Four clicks usually turn “the bill went up” into “USE1-NatGateway-Bytes in the production account went up”. If you are not sure what a usage type means, how to read your AWS bill covers the common ones.
2. When did it start?
Find the first day, not the week. With daily granularity, the step or the ramp is usually obvious. A step (flat, then suddenly higher and flat again) points at a single change: a new resource, a config edit, a pricing change. A ramp (rising every day) points at growth: traffic, data, a leak, or retries piling up.
The first day matters because the cause is almost always in the 24 hours before it. Remember that AWS cost data lags by up to a day, so “it started on Wednesday” can mean the change happened on Tuesday.
3. What changed in that window?
Deploys, scaling, new resources and configuration edits all leave a record, and the audit logs already have it:
- AWS: CloudTrail event history keeps 90 days of management events at no charge. Filter by the account and the window, then look at create, modify, run and scale actions (
RunInstances,CreateNatGateway,UpdateAutoScalingGroup,PutRetentionPolicy). - Azure: the Activity Log for the subscription.
- GCP: Admin Activity audit logs for the project.
- Kubernetes: rollout history and HPA events for the namespace.
The common trap is checking only deploys. Autoscaling, a new Region, a longer log retention or a changed instance type all cost money without any release going out.
4. Who changed it, and was it planned?
A load test and a runaway autoscaler look the same on a bill. So do a planned migration and a forgotten experiment. The audit event names the principal (a user, a role, a CI pipeline), so you know whom to ask. Ask before you roll anything back: sometimes the spike is expected, and the right action is to update the budget, not the infrastructure.
This is also the moment to write the answer down. A short note in the channel where the alert landed (“expected, load test until Friday”) saves the next person from repeating the investigation.
5. What is it costing per day?
The daily cost of the increase decides the urgency. Take the new daily cost for that line and subtract the old baseline. As an example, if NAT gateway processing went from $40 a day to $190 a day, the change costs $150 a day, or about $4,500 over a 30 day month. That is a today problem. An extra $3 a day is a next sprint problem.
Put the daily figure in the ticket. It turns “costs are up” into a priority someone can rank against other work.
Why do these questions get skipped?
Because each one lives in a different tool. The spike is in the billing console, the change is in CloudTrail or the Kubernetes history, the owner is in Slack, and the daily figure is arithmetic someone does in a spreadsheet. Stitching them together by hand is what turns a one minute alert into an hour of work.
Two habits shorten it. First, detect spikes per service rather than on the total bill, so a large change in a small service is not averaged away; what is a cloud cost anomaly explains how rolling baselines do that. Second, send alerts where the owners already work, with the actual and baseline cost in the message, so question 5 is answered before anyone opens a console.
How Xplorr helps with this
Xplorr’s anomaly detection compares each account, service and Region against its own 7 day average and flags a day that runs more than 50% above it. The alert goes to Slack and by email, and it names the service, Region, actual and baseline cost, spike size and severity, with a short AI written summary. That answers questions 1, 2 and 5 in the alert itself.
Questions 3 and 4 are what we are adding now. Evidence based root cause reads the change history around the spike (CloudTrail for AWS) and cites the events it considers most likely, and the person who gets the alert can mark it Expected, Investigating or Wrong cause. It is rolling out to selected organizations and is not generally available yet. If AWS is most of your bill, AWS cost anomaly detection compares Xplorr with the free AWS service. Xplorr is free during the private beta.
Keep reading
- What Is a Cloud Cost Anomaly (And Why You Should Care)
- 5 Signs Your Cloud Bill Is About to Spike
- How to Read Your AWS Bill: Five Places Spend Hides Outside EC2
See how Xplorr helps → Features
Written by
Xplorr team
The people who build Xplorr
Written together by the engineers who build Xplorr: the AWS, Azure, GCP and Kubernetes collectors, the console, and the alerting behind them.
About Xplorr